Total
Male
Female
Total
Male
Female
Total
Male
Female
Total
Male
Female
Total
Male
Female
Total
Male
Female
Total
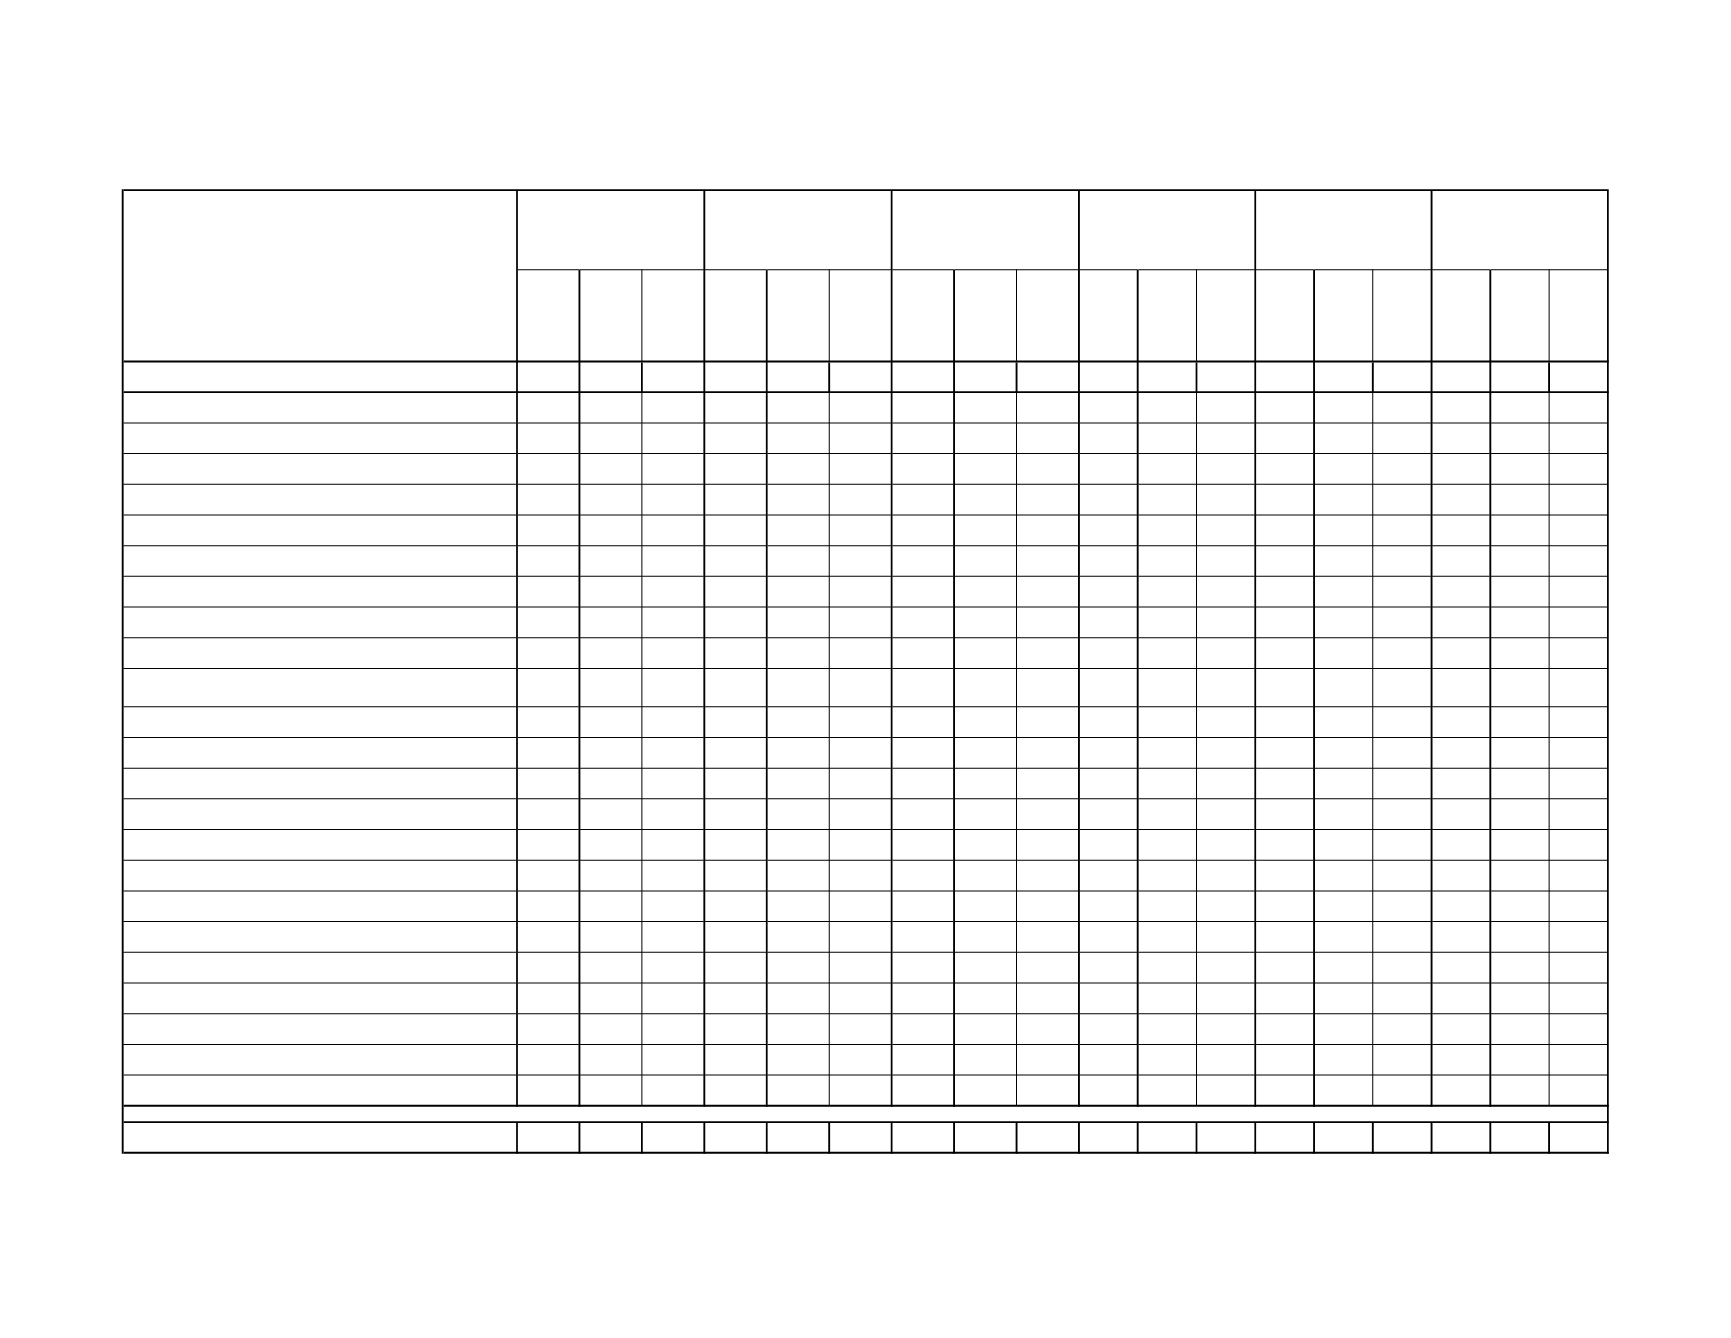
84,963 43,638 41,325 38,220 19,605 18,615 33,075 16,981 16,094 4,726 2,447 2,279 5,476 2,824 2,652 3,466 1,781 1,685
Birthswith congenital anomalies
633 354 279 263 150 113 265 139 126 41 27 14 46 27 19 18 11
7
Anencephalus
10?
*
7 10?
*
* 0?
*
* 0?
0
*
0
0
0
0
0
0
Spina bifida/meningocele
15
6
9 10?
*
* 0?
*
*
0
0
0 0?
0
*
0
0
0
Hydrocephalus
16
9
7 10?
*
* 10?
*
* 0?
*
0 0?
0
*
0
0
0
Microcephalus
0?
*
* 0?
*
* 0?
*
0
0
0
0
0
0
0
0
0
0
Other CNS anomaly
20
9 11 12
6
6 10?
*
*
0
0
0
0
0
0 0?
0
*
Heartmalformations
76 43 33 34 16 18 31 19 12 10?
*
0 0?
*
* 0?
*
*
Other respiratory/circulatory anomalies
131 74 57 25 15 10 85 46 39 13
7
6 10?
*
0 0?
*
*
Rectal atresia/stenosis
0?
*
0 0?
*
0 0?
*
0
0
0
0
0
0
0
0
0
0
Tracheo-esophageal fistula/esophageal
atresia
10?
*
* 0?
*
* 0?
*
*
0
0
0 0?
0
* 0?
*
0
Omphalocele/gastroschisis
22
9 13 10?
7
* 10?
*
6
0
0
0 0?
0
*
0
0
0
Other gastrointestinal anomalies
19
8 11 10?
*
* 10?
*
*
0
0
0 0?
*
*
0
0
0
Malformedgenitalia
10?
*
* 0?
*
0 0?
*
* 0?
*
0 0?
*
*
0
0
0
Renal agenesis
10?
*
* 0?
*
* 0?
*
* 0?
*
0
0
0
0
0
0
0
Other urogenital anomalies
46 37
9 20 14
6 20? 19
* 0?
*
0 0?
*
0 0?
*
0
Cleft lip/palate
59 36 23 21 15
6 21 11 10 0?
*
0 12
6
6 0?
*
*
Polydactyly/Syndactyly/Adactyly
27 18
9 15
9
6 10?
*
* 0?
*
0 10?
*
0
0
0
0
Club foot
51 31 20 27 16 11 19 12
7 0?
*
* 0?
*
*
0
0
0
Diaphragmatic hernia
0?
*
0 0?
*
0
0
0
0
0
0
0 0?
*
0
0
0
0
Othermuscosceletal/integumental anomalies
23 11 12 10?
*
* 10?
6
* 0?
*
* 0?
*
* 0?
0
*
Down syndrome
36 21 15 24 16
8 10?
*
6 0?
0
*
0
0
0
0
0
0
Other chromosomal anomalies
29 19 10 10?
7
* 10?
8
* 0?
*
0 0?
0
* 0?
*
0
Other congenital anomalies
138 68 70 65 33 32 45 19 26 10?
9
* 10?
*
* 10?
*
*
Ratioper 100births
a
0.7 0.8 0.7 0.7 0.8 0.6 0.8 0.8 0.8 0.9 1.1 0.6 0.8 1.0 0.7 0.5 0.6 0.4
TABLE1B-35
BIRTHSWITHCONGENITALANOMALIESMENTIONEDONBIRTHCERTIFICATEBYMOTHER'SRACE/ETHNICITYAND
CHILD'SGENDER, ARIZONA, 2013
American Indianor
AlaskaNative
Asianor Pacific
Islander
Notes: * Cell suppressed due to non-zero count less than 6; ? Sum rounded to nearest tens unit due to non-zero addend less than 6;
a
For denominators see Table 5B-8.
All groups
Whitenon-Hispanic Hispanic or Latino Black or African
American
Arizona Health Status and Vital Statistics 2013
79


