4A. I
NPATIENT
D
ISCHARGES FROM
S
HORT
-S
TAY
H
OSPITALS BY
F
IRST
-L
ISTED
D
IAGNOSISAND
P
ATIENT
C
HARACTERISTICS
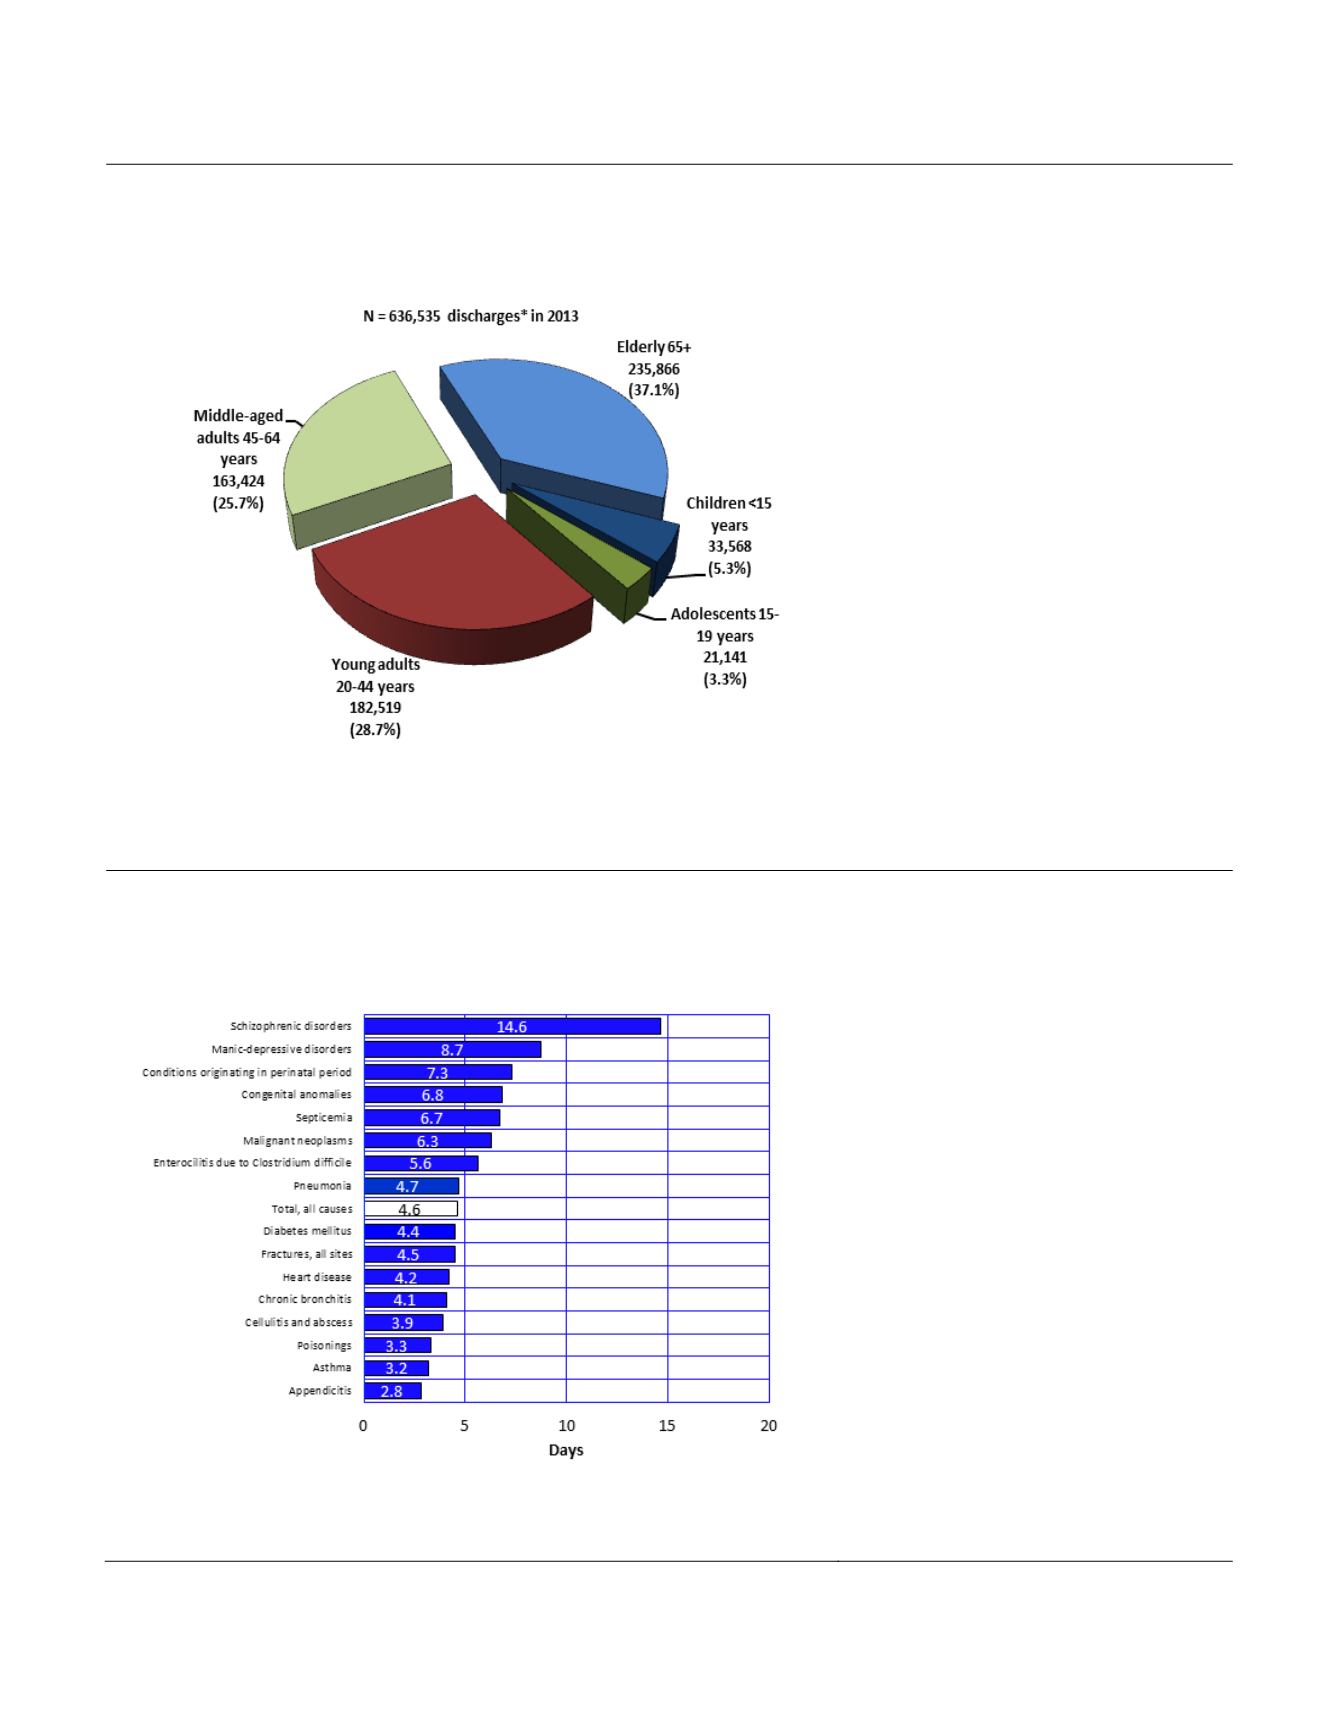
Figure4A-1
Hospital Inpatient Discharges
a
byAgeGroup, ArizonaResidents, 2013
Note:
a
Excluding newborn infants.
In 2013, there were 636,535 inpatients
discharged, excluding newborn infants,
from non-Federal short stay hospitals in
Arizona (
Table 4A-1
). Patients
who were elderly (65 years or older)
accounted for 37.1 percent of hospital
discharges (
Figure 4A-1
), followed by
young adults (20-44 years old) who
comprised 28.7 percent of discharges,
and middle-aged adults 45-64 year olds
(25.7 percent of all inpatient discharges)
Diseases of the circulatory system
were
the most common diagnoses (13.1
percent of all discharges), followed by
diseases of the
digestive system
(10.3
percent), and
injury and poisoning
diagnoses (9.7 percent; percentages
based on data in
Table4A-1
).
Figure4A-2
Average Lengthof Hospital Stay for DischargeswithSelected
First-listedDiagnosis, ArizonaResidents, 2013
Based on the data from the National
Hospital Discharge Survey, the longest
continuously
running
nationally
representative survey of hospital
utilization, the length of stay for
inpatients has changed dramatically from
1970 through 2010. In 1970, the average
length of stay was 7.8 days, with one-
third of patients hospitalized for 8 days or
more. In 2010, the average length of
stay nationally was 4.8 days.
In 2013, the average length of hospital
stay for Arizona inpatients was 4.6 days
(
Figure 4A-2
,
Table 4A-5
). The percent
of patients hospitalized for 3 days or less
was 59.8 percent, with 14.1 percent of
inpatients staying 8 days or more.
The average length of stay was 4.2 days
for heart disease, 4.4 days for diabetes,
6.3 days for cancer, and 14.6 days for
schizophrenic disorders.
230
Arizona Health Status and Vital Statistics 2013


