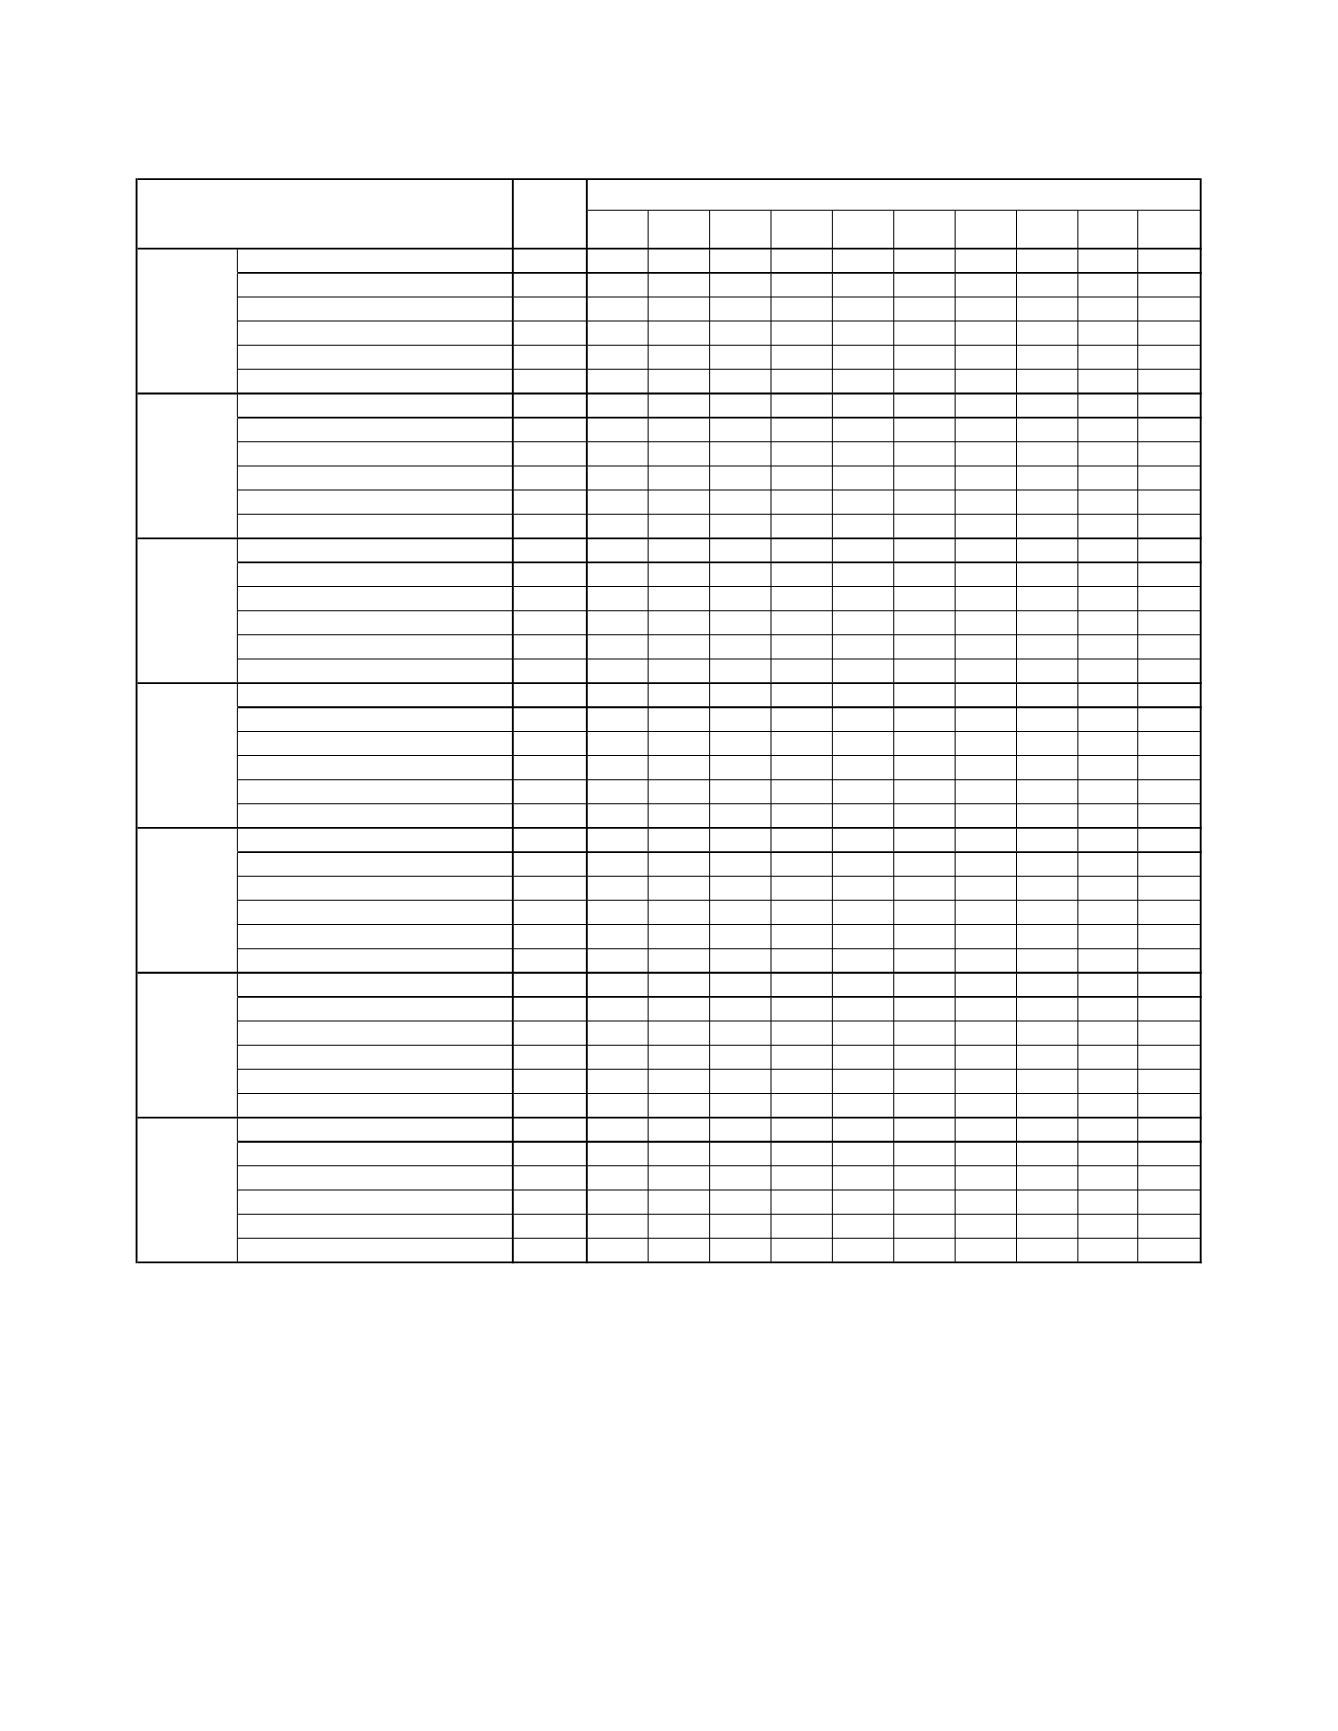
<15 15-17 18-19 20-24 25-29 30-34 35-39 40-44 45+ Un-
known
Total
1,740? 0? 40? 140? 610? 513 300? 120? 20? 0?
0
Whitenon-Hispanic
1,260?
* 19 100 439 383 218 77 18
*
0
Hispanic or Latino
360?
0 12 33 135 97 53 30
*
0
0
Black or AfricanAmerican
10?
0
0
0
*
6
*
*
0
0
0
American Indianor AlaskaNative
70?
0
*
* 18 17 16
*
*
0
0
Asianor Pacific Islander
40?
0
*
*
8 10 14
9
0
0
0
Total
1,550? 0? 40? 140? 520? 420? 270? 130? 31 0?
0
Whitenon-Hispanic
550?
*
* 40 160 165 116 49 10
0
0
Hispanic or Latino
120?
0
* 10 46 31 15
9
0
0
0
Black or AfricanAmerican
10?
0
0
*
*
*
0
*
0
0
0
American Indianor AlaskaNative
870?
* 35 88 315 211 134 64 21
*
0
Asianor Pacific Islander
10?
0
0
0
*
6
*
*
0
0
0
Total
11,965 10? 280? 712 3,072 3,459 2,856 1,263 285 20?
0
Whitenon-Hispanic
5,019
0 51 198 1,056 1,508 1,469 604 120 13
0
Hispanic or Latino
5,350? 10 193 398 1,618 1,490 1,024 488 121
*
0
Black or AfricanAmerican
590?
*
8 49 183 172 111 53 15
*
0
American Indianor AlaskaNative
540?
* 30 57 168 147 85 34 12
*
0
Asianor Pacific Islander
470?
0
* 10 47 142 167 84 17
*
0
Total
4,560? 0? 100? 290? 1,166 1,405 1,068 446 80? 0?
0
Whitenon-Hispanic
2,370?
* 33 107 524 780 620 250 52
*
0
Hispanic or Latino
1,460?
* 43 125 430 406 308 122 18
*
0
Black or AfricanAmerican
210?
0
* 18 61 63 43 15
*
0
0
American Indianor AlaskaNative
430?
0 20 41 137 128 60 37
*
0
0
Asianor Pacific Islander
110?
0
0
* 14 28 37 22
7
*
0
Total
650? 0? 23 50? 190? 160? 150? 72 10?
0
0
Whitenon-Hispanic
40?
0
0
0
7 14
8
6
*
0
0
Hispanic or Latino
600?
* 23 52 174 144 134 66
9
0
0
Black or AfricanAmerican
10?
0
0
*
*
*
0
0
0
0
0
American Indianor AlaskaNative
0?
0
0
0
0
*
*
0
0
0
0
Asianor Pacific Islander
0?
0
0
0
0
*
*
0
0
0
0
Total
1,820? 0? 40? 120? 550? 541 370? 150? 40? 0?
0
Whitenon-Hispanic
1,290?
0 18 72 371 404 280 105 32
*
0
Hispanic or Latino
420?
* 19 40 138 102 75 37
8
0
0
Black or AfricanAmerican
20?
0
0
*
6
6
*
*
0
0
0
American Indianor AlaskaNative
70?
0
*
* 27 19
6
6
*
0
0
Asianor Pacific Islander
30?
0
0
*
* 10
8
*
*
0
0
Total
3,120? 0? 120? 260? 988 905 570? 220? 50? 10?
0
Whitenon-Hispanic
640?
0
7 30 156 206 177 52
9
*
0
Hispanic or Latino
2,340?
* 108 217 789 656 370 153 40
*
0
Black or AfricanAmerican
50?
0
0
* 17 17
*
*
*
0
0
American Indianor AlaskaNative
50?
0
* 10 17 13
*
*
*
0
0
Asianor Pacific Islander
50?
0
0
*
9 13 14
7
*
0
0
TABLE5B-10 (continued)
BIRTHSBYMOTHER'SAGEGROUP, RACE/ETHNICITY, ANDCOUNTYOFRESIDENCE, ARIZONA, 2013
Total
Mother?s age group
Mohave
Navajo
Pima
Yuma
Notes: * Cell suppressed due to non-zero count less than 6; ? Sum rounded to nearest tens unit due to non-zero addend less than 6.
Pinal
SantaCruz
Yavapai
284
Arizona Health Status and Vital Statistics 2013


