Apache
Cochise
Coconino
Gila
Graham
Greenlee
LaPaz
Maricopa
Mohave
Navajo
Pima
Pinal
Santa Cruz
Yavapai
Yuma
Unknown
636,535 3,700? 13,600? 9,740 6,888 4,200 710? 1,960? 385,977 23,670? 9,992 96,152 38,378 3,307 21,662 16,592 10?
Female
368,452 1,770 7,795 5,430 3,785 2,391 412 1,031 226,199 12,655 5,390 56,330 21,391 2,026 12,002 9,843 *
Male
268,077 1,928 5,801 4,310 3,103 1,809 301 925 159,777 11,019 4,602 39,821 16,987 1,281 9,656 6,749 8
Unknown
10?
0
0
0
0
0 0
0
*
0
0
*
0
0
*
0 0
Children<15 years
33,568 238
559 797 257 349 52 79 21,069
720 804 4,817 2,159 224 757 687 0
Adolescents 15-19
years
21,141 96
381 356 152 181 49 56 13,698
404 388 3,007 1,141 137 470 625 0
Young adults 20-44
years
182,519 920 3,054 3,111 1,197 1,481 234 377 118,534 3,878 2,997 26,397 10,898 947 3,761 4,729 *
Middle-aged adults
45-64 years
163,424 1,086 3,224 2,734 1,817 1,105 170 463 99,581 6,415 2,640 24,884 9,942 676 5,397 3,285 *
Elderly 65+ years
235,866 1,352 6,378 2,742 3,465 1,084 208 981 133,090 12,256 3,158 37,047 14,238 1,323 11,277 7,266 *
Unknown
20?
6
0
0
0
0 0
0
*
*
*
0
0
0
0
0 0
American Indianor
AlaskaNative
26,372 2,062
67 2,642 628 1,421 11 330 7,185
501 4,305 3,233 3,398
8 316 265 0
Asianor Pacific
Islander
9,550? 13
173 37 27 13 *
7 7,256
118 32 1,344 338 15 71 106 0
Black or African
American
31,030? 20
380 126 19 32 * 19 24,468
207 85 3,716 1,557 13 107 276 0
Hispanic or Latino
129,662 198 3,274 1,047 852 718 227 211 79,305 1,219 537 24,107 6,731 2,555 1,390 7,291 0
Whitenon-Hispanic
432,201 1,379 9,444 5,757 5,202 1,945 456 1,347 263,484 21,389 4,959 62,322 25,884 684 19,576 8,364 9
Other
1,410?
*
* 58 104 29 *
*
909
* 18
11 186
0 16 67 0
Refused
6,311 25
256 73 56 42 11 38 3,370
239 56 1,419 284 32 186 223 *
Single
228,333 1,524 3,805 4,013 2,113 1,821 257 691 143,656 6,544 4,154 35,251 13,158 1,145 5,450 4,743 8
Married
272,682 1,466 6,683 4,035 3,113 1,653 345 864 161,960 10,787 4,087 39,722 17,933 1,489 10,511 8,034 0
Separated
6,420? 43
90 132 45 34 * 12 3,913
202 91
767 382 36 311 356 0
Divorced
52,749 225 1,108 577 588 272 37 138 32,505 2,351 701 7,852 2,918 216 2,004 1,256 *
Widowed
71,101 311 1,696 740 974 342 63 203 41,874 3,615 742 11,217 3,728 379 3,072 2,145 0
Unknown
4,998 127
214 242 53 76 8 47 1,850
167 213 1,341 251 42 312 54 *
Not applicable
260?
*
0
*
*
* 0
*
219
8
*
*
8
0
*
* 0
Self
43,365 177
818 855 321 167 37 111 28,197 1,151 459 6,184 2,124 272 1,235 1,256 *
Private insurance
(indemnity, HMO,
PPO)
167,162 568 3,167 2,822 1,428 1,100 321 336 108,602 4,363 1,792 24,332 9,703 567 5,308 2,751 *
AHCCCS/Medicaid
134,500 818 2,389 2,264 1,119 1,113 103 368 83,696 3,780 2,620 20,329 7,746 949 3,399 3,806 *
Medicare
197,401 1,327 5,210 2,921 3,619 1,189 217 955 111,153 11,423 3,157 26,897 11,820 733 10,388 6,388 *
Other
94,107 808 2,012 878 401 631 35 186 54,329 2,957 1,964 18,410 6,985 786 1,332 2,391 *
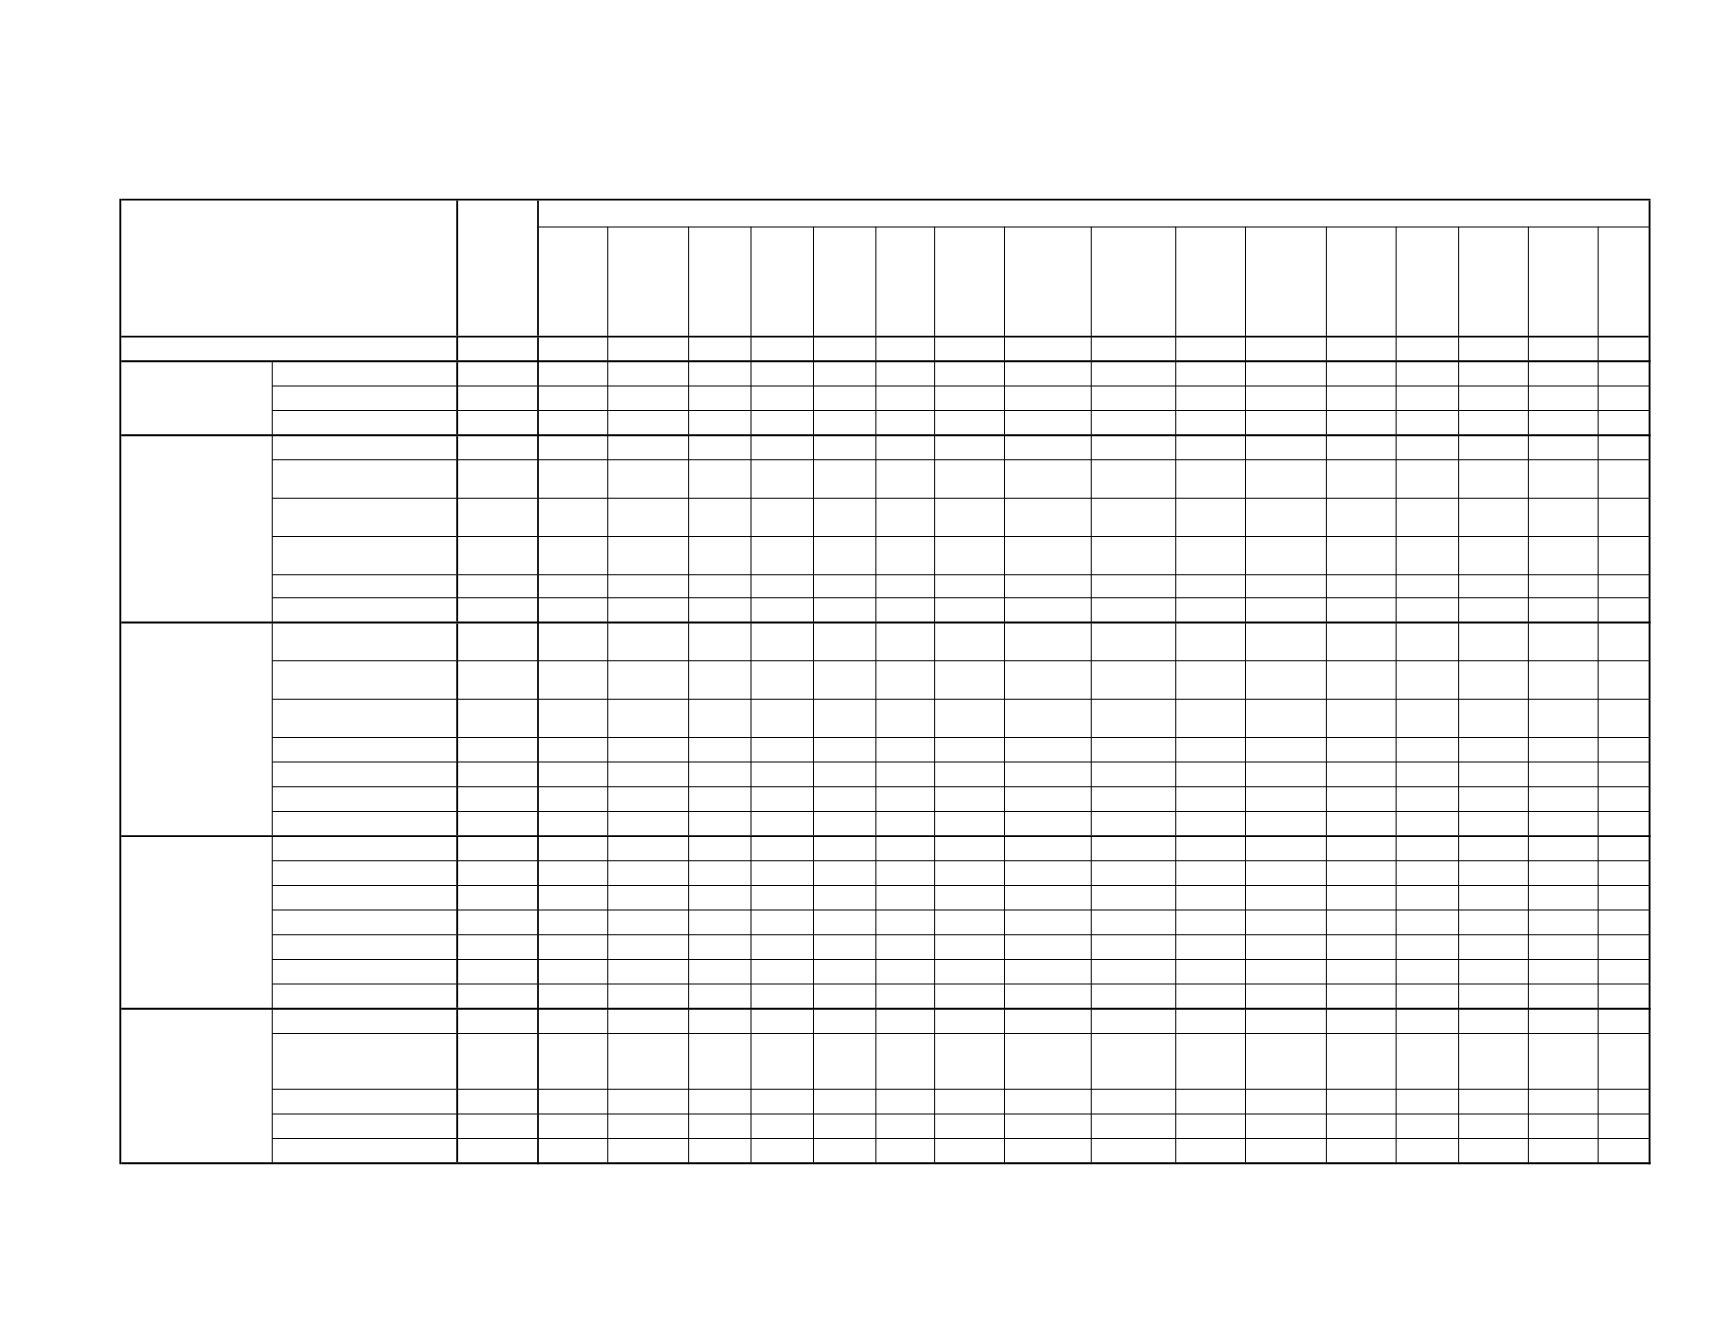
TABLE7A-2
NUMBEROFDISCHARGES
a
BYGENDER, AGEGROUP, RACE/ETHNICITY, MARITAL STATUS, PRIMARYPAYER, AND
COUNTYOFRESIDENCE, ARIZONA, 2013
Selected characteristics
Total
County of residence
Total
Gender
Age group
Notes: * Cell suppressed due to non-zero count less than 6; ? Sum rounded to nearest tens unit due to non-zero addend less than 6;
a
Excluding newborn infants.
Race/ethnicity
Patient's
marital status
Primary payer
396
Arizona Health Status and Vital Statistics 2013


