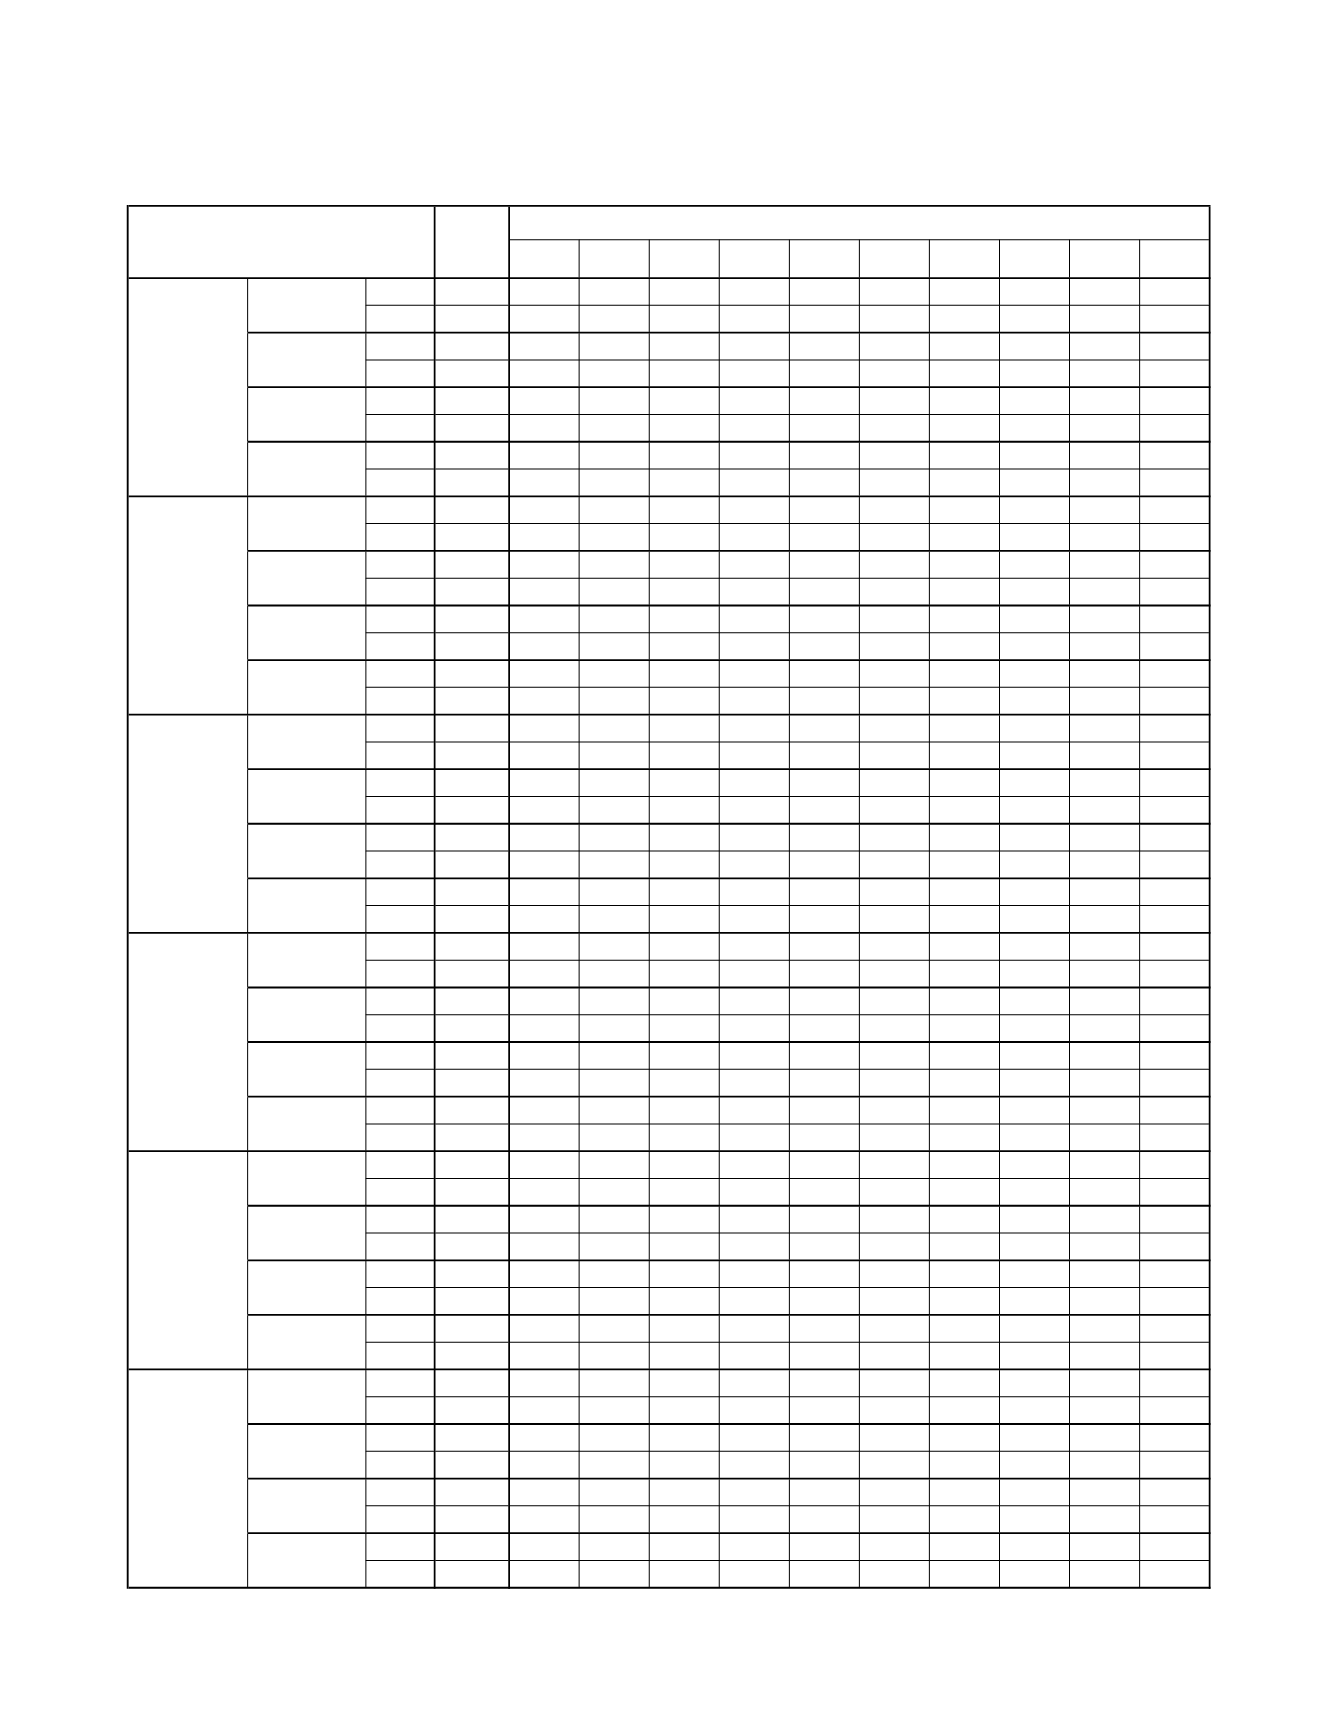
<15 15-17 18-19 20-24 25-29 30-34 35-39 40-44 45+ Un-
known
Count
45,605
0
62 658 7,076 14,928 14,543 6,834 1,390 110
*
Percent
53.7% 0.0% 3.1% 12.7% 33.0% 60.5% 72.8% 72.7% 67.1% 66.7% **
Count
38,352
71 1,922 4,492 14,175 9,429 5,185 2,419 618
37
*
Percent
45.1% 100.0% 96.8% 87.0% 66.0% 38.2% 26.0% 25.7% 29.8% 22.4% **
Count
1,010?
0
*
16 213 309 241 144
63
18
*
Percent
1.2% 0.0% ** 0.3% 1.0% 1.3% 1.2% 1.5% 3.0% 10.9% **
Count
84,963
71 1,985 5,166 21,464 24,666 19,969 9,397 2,071 165
9
Percent
100.0% 100.0% 100.0% 100.0% 100.0% 100.0% 100.0% 100.0% 100.0% 100.0% 100.0%
Count
26,156
0
11 201 3,458 8,849 8,933 3,909 734
57
*
Percent
68.4% 0.0% 3.0% 14.3% 43.6% 73.9% 83.2% 83.0% 74.4% 65.5% **
Count
11,564
8 353 1,203 4,362 2,966 1,703 736 216
14
*
Percent
30.3% 100.0% 96.7% 85.4% 55.0% 24.8% 15.9% 15.6% 21.9% 16.1% **
Count
500?
0
*
* 116 157 103
65
37
16
*
Percent
1.3% 0.0% **
** 1.5% 1.3% 1.0% 1.4% 3.7% 18.4% **
Count
38,220
8 365 1,408 7,936 11,972 10,739 4,710 987
87
8
Percent
100.0% 100.0% 100.0% 100.0% 100.0% 100.0% 100.0% 100.0% 100.0% 100.0% 100.0%
Count
13,802
0
45 400 2,927 4,368 3,672 1,947 409
34
0
Percent
41.7% 0.0% 3.6% 14.3% 29.4% 49.0% 59.6% 61.0% 56.3% 73.9% 0.0%
Count
18,886
47 1,199 2,379 6,940 4,437 2,388 1,186 297
12
*
Percent
57.1% 100.0% 96.4% 85.3% 69.8% 49.7% 38.8% 37.1% 40.9% 26.1% **
Count
387
0
0
10
80 117 100
60
20
0
0
Percent
1.2% 0.0% 0.0% 0.4% 0.8% 1.3% 1.6% 1.9% 2.8% 0.0% 0.0%
Count
33,075
47 1,244 2,789 9,947 8,922 6,160 3,193 726
46
*
Percent
100.0% 100.0% 100.0% 100.0% 100.0% 100.0% 100.0% 100.0% 100.0% 100.0% **
Count
1,680?
0
*
27 277 520 520 262
63
8
0
Percent
35.5% 0.0% ** 7.1% 18.9% 39.8% 56.6% 61.6% 64.9% 100.0% 0.0%
Count
3,010
6 120 352 1,181 776 388 156
31
0
0
Percent
63.7% 100.0% 98.4% 92.9% 80.7% 59.4% 42.3% 36.7% 32.0% 0.0% 0.0%
Count
40?
0
0
0
6
11
10
7
*
0
0
Percent
0.8% 0.0% 0.0% 0.0% 0.4% 0.8% 1.1% 1.6% ** 0.0% 0.0%
Count
4,726
6 122 379 1,464 1,307 918 425
97
8
0
Percent
100.0% 100.0% 100.0% 100.0% 100.0% 100.0% 100.0% 100.0% 100.0% 100.0% 0.0%
Count
1,080?
0
*
15 225 348 305 143
37
*
0
Percent
19.6% 0.0% ** 2.9% 12.7% 23.7% 33.0% 34.0% 37.4% ** 0.0%
Count
4,336
8 242 508 1,544 1,102 598 268
59
7
0
Percent
79.2% 100.0% 99.6% 96.9% 86.8% 75.0% 64.7% 63.8% 59.6% 63.6% 0.0%
Count
60?
0
0
*
9
19
21
9
*
*
0
Percent
1.2% 0.0% 0.0% ** 0.5% 1.3% 2.3% 2.1% **
** 0.0%
Count
5,476
8 243 524 1,778 1,469 924 420
99
11
0
Percent
100.0% 100.0% 100.0% 100.0% 100.0% 100.0% 100.0% 100.0% 100.0% 100.0% 0.0%
Count
2,890?
0
*
15 189 843 1,113 573 147
9
0
Percent
83.4% 0.0% ** 22.7% 55.8% 84.6% 90.6% 88.3% 90.7% 69.2% 0.0%
Count
560?
*
8
50 148 148 108
73
15
*
0
Percent
16.0% ** 72.7% 75.8% 43.7% 14.9% 8.8% 11.2% 9.3% ** 0.0%
Count
20?
0
0
*
*
*
7
*
0
0
0
Percent
0.5% 0.0% 0.0% **
**
** 0.6% ** 0.0% 0.0% 0.0%
Count
3,470?
*
11
66 339 996 1,228 649 162
13
0
Percent
100.0% ** 100.0% 100.0% 100.0% 100.0% 100.0% 100.0% 100.0% 100.0% 0.0%
Notes: * Cell suppressed due to non-zero count less than 6; ** Cell suppressed due to rate/ratio/percent based on non-zero count less than 6; ? Sum
rounded to nearest tens unit due to non-zero addend less than 6;
a
May include the following: "Refused", "Yes, divorced" and "Unknown".
Asianor
Pacific
Islander
Married
Unmarried
Other
TOTAL
American
Indianor
AlaskaNative
Married
Unmarried
Other
TOTAL
Black or
African
American
Married
Unmarried
Other
TOTAL
Hispanic or
Latino
Married
Unmarried
Other
TOTAL
Whitenon-
Hispanic
Married
Unmarried
Other
TOTAL
All racial/
ethnic groups
Married
Unmarried
Other
a
TOTAL
Mother?s age group
TABLE1B-23
TOTALBIRTHSANDRATIOSOFBIRTHBYMOTHER'SMARITAL STATUS,
AGEGROUP, ANDRACE/ETHNICITY, ARIZONA, 2013
TOTAL
52
Arizona Health Status and Vital Statistics 2013


