1D. ABORTIONS
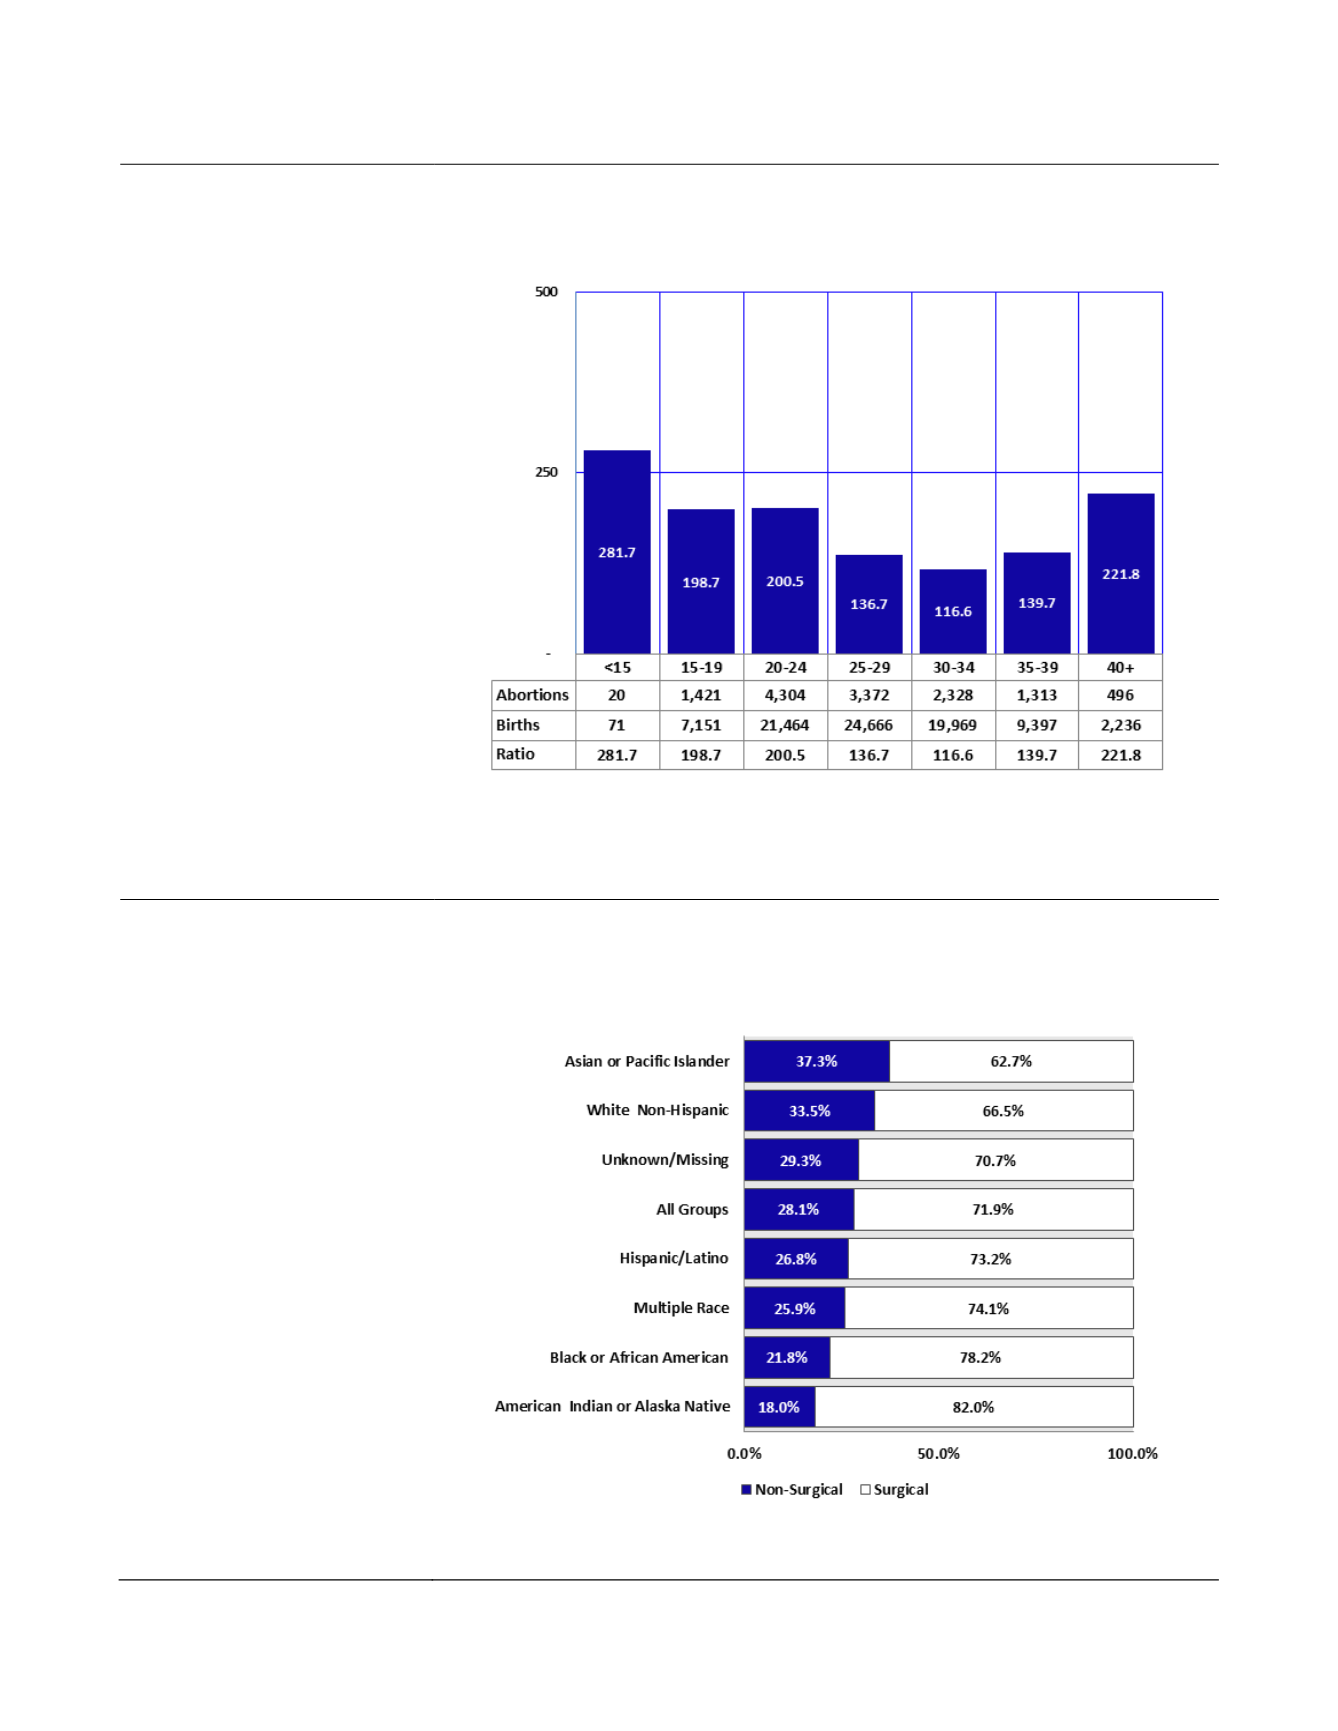
Abortion ratios (the number of
abortions per 1,000 live births in
each age group) vary by age at
reported
termination
of
pregnancy. Ratios tend to be
higher at the extremes of the
age
distribution
of
the
childbearing period, i.e. among
women under age 15 and those
aged 40 years or older (
Figure-
1D-3
).
A comparison of age-specific
abortion ratios by race/ethnicity
is provided in
Table1D-5
.
Figure1D-3
AbortionRatios
a
byAgeGroup, ArizonaResidents, 2013
Notes:
a
Number of reported abortions per 1,000 live births in specified group.
In 2013, non-surgical (also
called ?medical?) abortions
made up 28.1 percent of all
procedures reported in Arizona.
Among Asians, White non-
Hispanics, and cases with
unknown
or
missing
race/ethnicity, the proportion of
non-surgical abortions exceeded
the average for all groups
(
Figure 1D-4
). The ratios of
non-surgical abortions among
American Indian women, Black
or African American women,
women reporting 2 or more
racial/ethnic categories, and
Hispanic or Latino women were
the lowest among racial/ethnic
groups.
Figure1D-4
Proportional Contributionof Non-Surgical
a
andSurgical Abortions byRace/Ethnicity,
ArizonaResidents, 2013
Notes:
a
Non-surgical: Mifepristone, Methotrexate, RU486, etc.; Reporting changes related to race/ethnicitymakes comparisons with
previous years difficult.
Arizona Health Status and Vital Statistics 2013
91


