2C.AGE-SPECIFICMORTALITY
Childhoodmortality (ages 1-14 years)
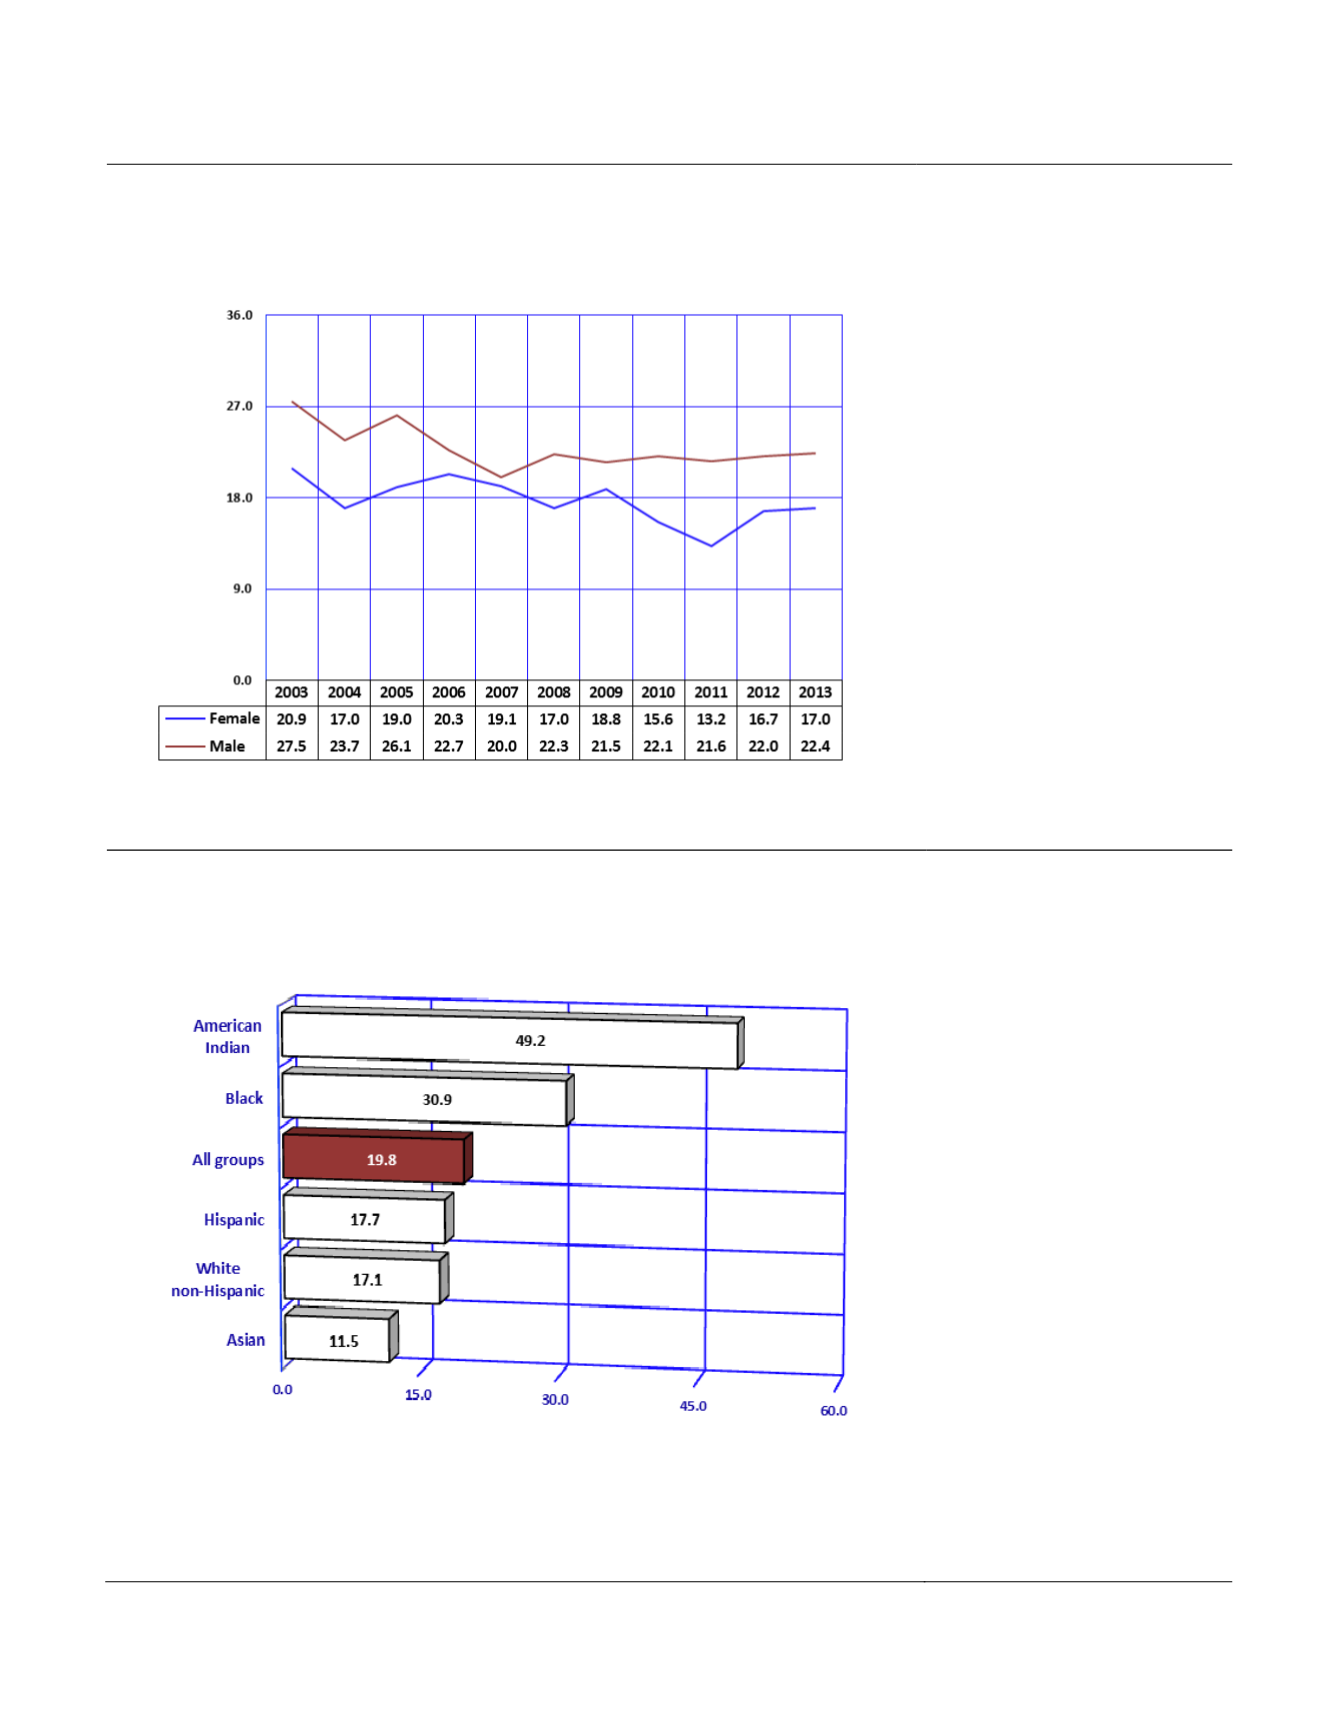
Figure2C-5
MortalityRates
a
byGender andYear amongChildren1-14Years,
Arizona, 2003-2013
Notes:
a
Number of deaths per 100,000 persons, 1-14 years old in specified group.
Death claimed the lives of 252 of
the 1,275,227 children (1 to 14
years old) residing in Arizona in
2013. Their 2013 mortality rate
of 19.8 per 100,000 was 2.1
percent greater than the rate of
19.4 in 2012 (
Table 2C-7
). Both
males and females experienced
slight increases in their total
mortality rates from 2012 to
2013 (
Figure 2C-5
,
Table 2C-
7
).
The five causes with the greatest
mortality rates in childhood from
2003-2013 were
accidents
(unintentional
injuries),
malignant neoplasms
,
congenital
malformations
,
homicide,
and
suicide
(
Table 2C-7
).
Figure2C-6
MortalityRates
a
byRace/Ethnicity amongChildren1-14Years,
Arizona, 2013
Notes:
a
Number of deaths per 100,000 persons, 1-14 years old in specified group.
American Indian children had
the highest 2013 total mortality
rate (49.2 deaths per 100,000)
followed by Black or African
American
children
(30.9/100,000;
Figure2C-6
).
The mortality rates of Hispanic
or Latino, White non-Hispanic,
and Asian children were lower
than the average rate for all
groups.
In 2013, there were 20 children
who died of accidental
drowning and submersion, 19
children who died of assault,
and 8 completed
suicides
of
children aged 1-14 years
(
Table 2C-10
). The mortality
rate for Native American
children due to automobile
accidents
((10/77,196)*100,000 = 13.0)
was 4.8 times greater than the
automobile accident mortality
rate for White non-Hispanic
children
((15/561,898)*100,000=2.7).
156
Arizona Health Status and Vital Statistics 2013


