2C.AGE-SPECIFICMORTALITY
Childhoodmortality (ages 1-14 years)
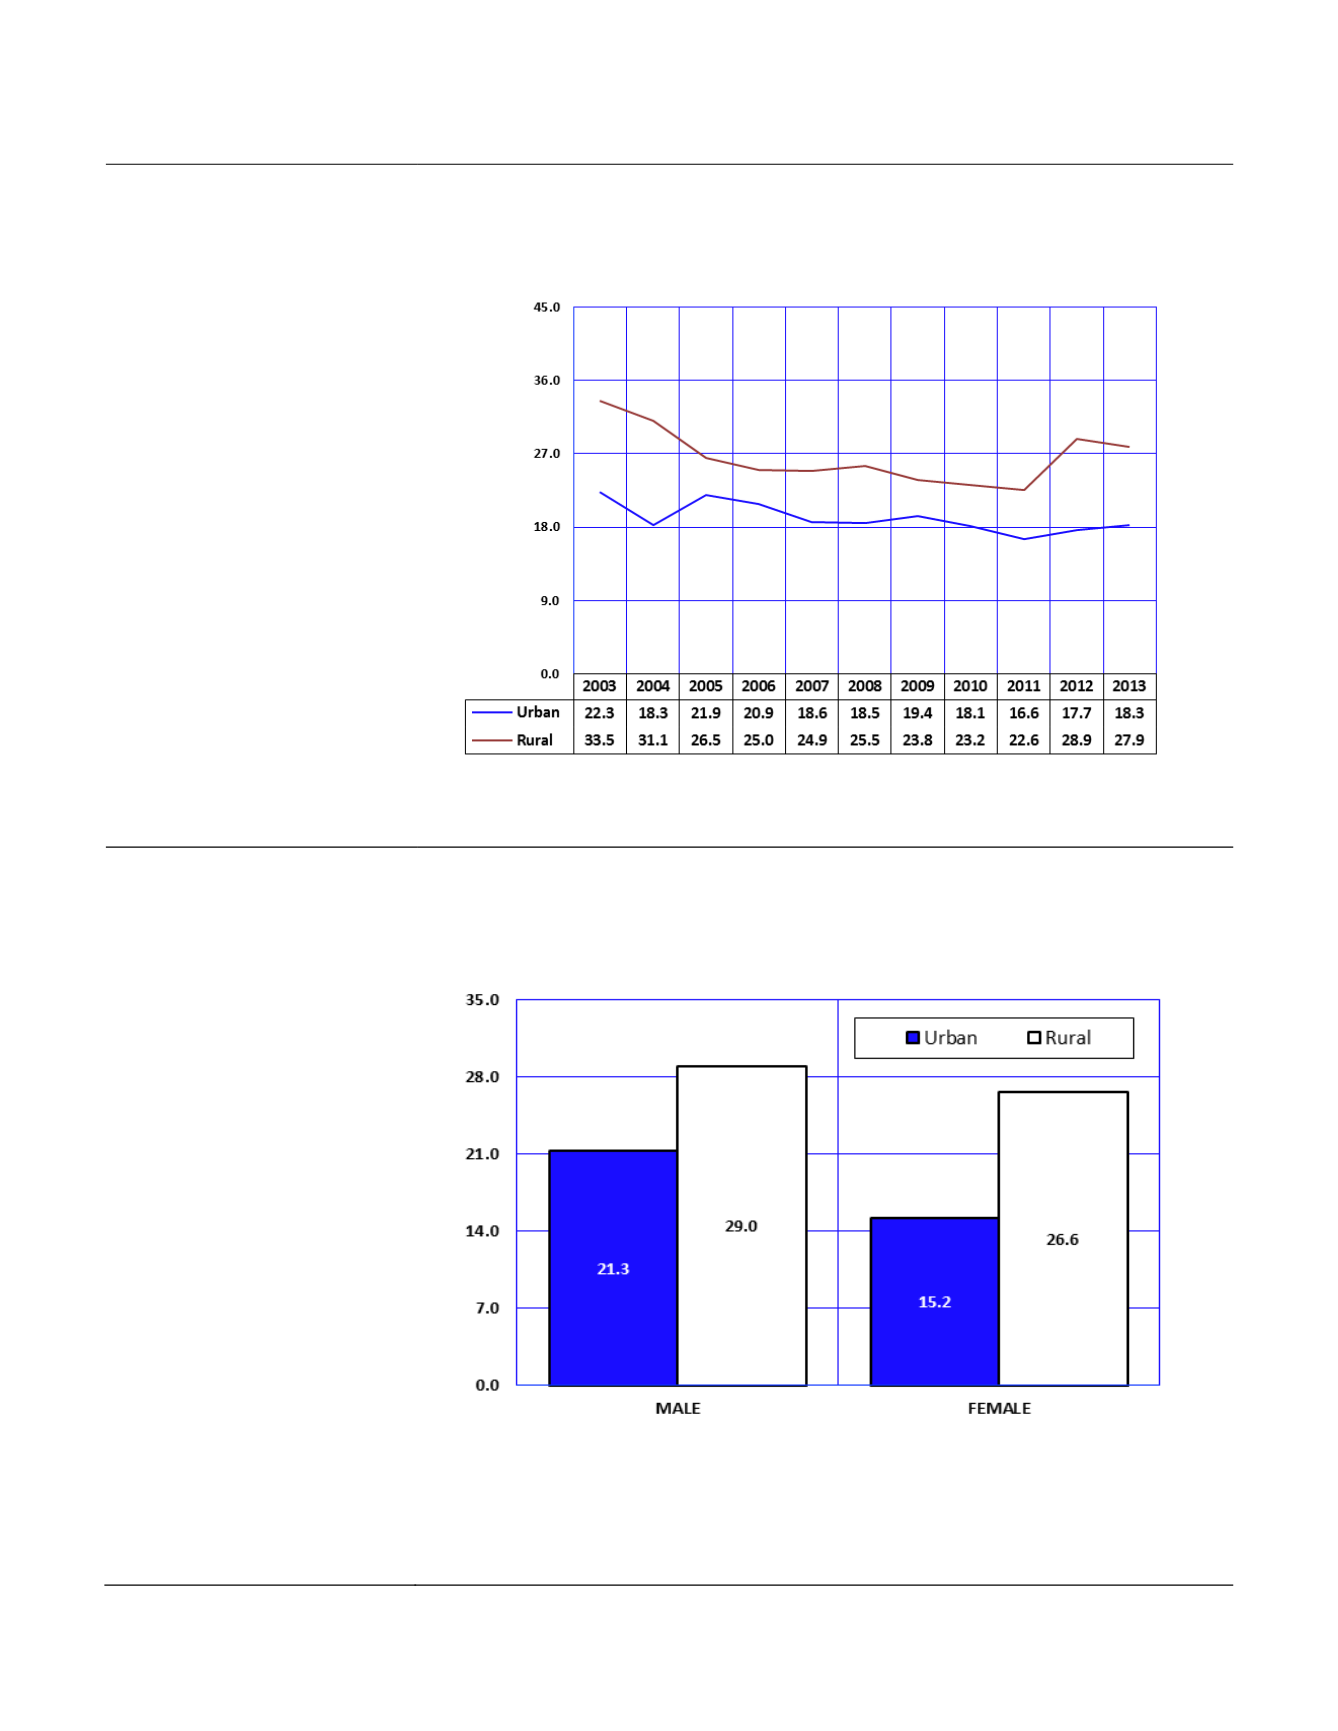
From 2012 to 2013, overall
mortality rates increased for
urban children but decreased
for rural children (
Figure 2C-7,
Table 2C-8
). From 2003 to
2013 the total mortality rates
decreased by 17.9 percent for
urban children and by 16.7
percent for rural children.
Figure2C-7
MortalityRates
a
byUrban/Rural Area
b
andYear amongChildren1-14Years,
Arizona, 2003-2013
Notes:
a
Number of deaths per 100,000 persons, 1-14 years old in specified group;
b
Urban counties areMaricopa, Pima, Pinal, and Yuma
Counties, Rural Counties are those remaining.
From 2012 to 2013, the
mortality rate for accidents
slightly increased for both urban
and rural children (
Table 2C-
8
). The mortality rate for
unintentional injuries among
rural children (12.6/100,000)
was 2.3 times greater than the
rate among urban children
(5.5/100,000,
Table 2C-8
). In
2013, 20 children in urban
areas died of accidental
drowning while no rural children
died of this cause (
Table 2C-
10
).
Urban females 1-14 years old
had the lowest mortality risk
among gender by area groups
in 2013, followed by urban
males, rural females, and rural
males.
Figure2C-8
MortalityRates
a
byGender inUrban/Rural
b
Areas amongChildren1-14Years,
Arizona, 2013
Notes:
a
Number of deaths per 100,000 persons, 1-14 years old in specified group;
b
Urban counties includeMaricopa, Pima, Pinal, and Yuma
Counties, Rural Counties are those remaining.
Arizona Health Status and Vital Statistics 2013
157


