2C.AGE-SPECIFICMORTALITY
Young adultmortality (ages 20-44 years)
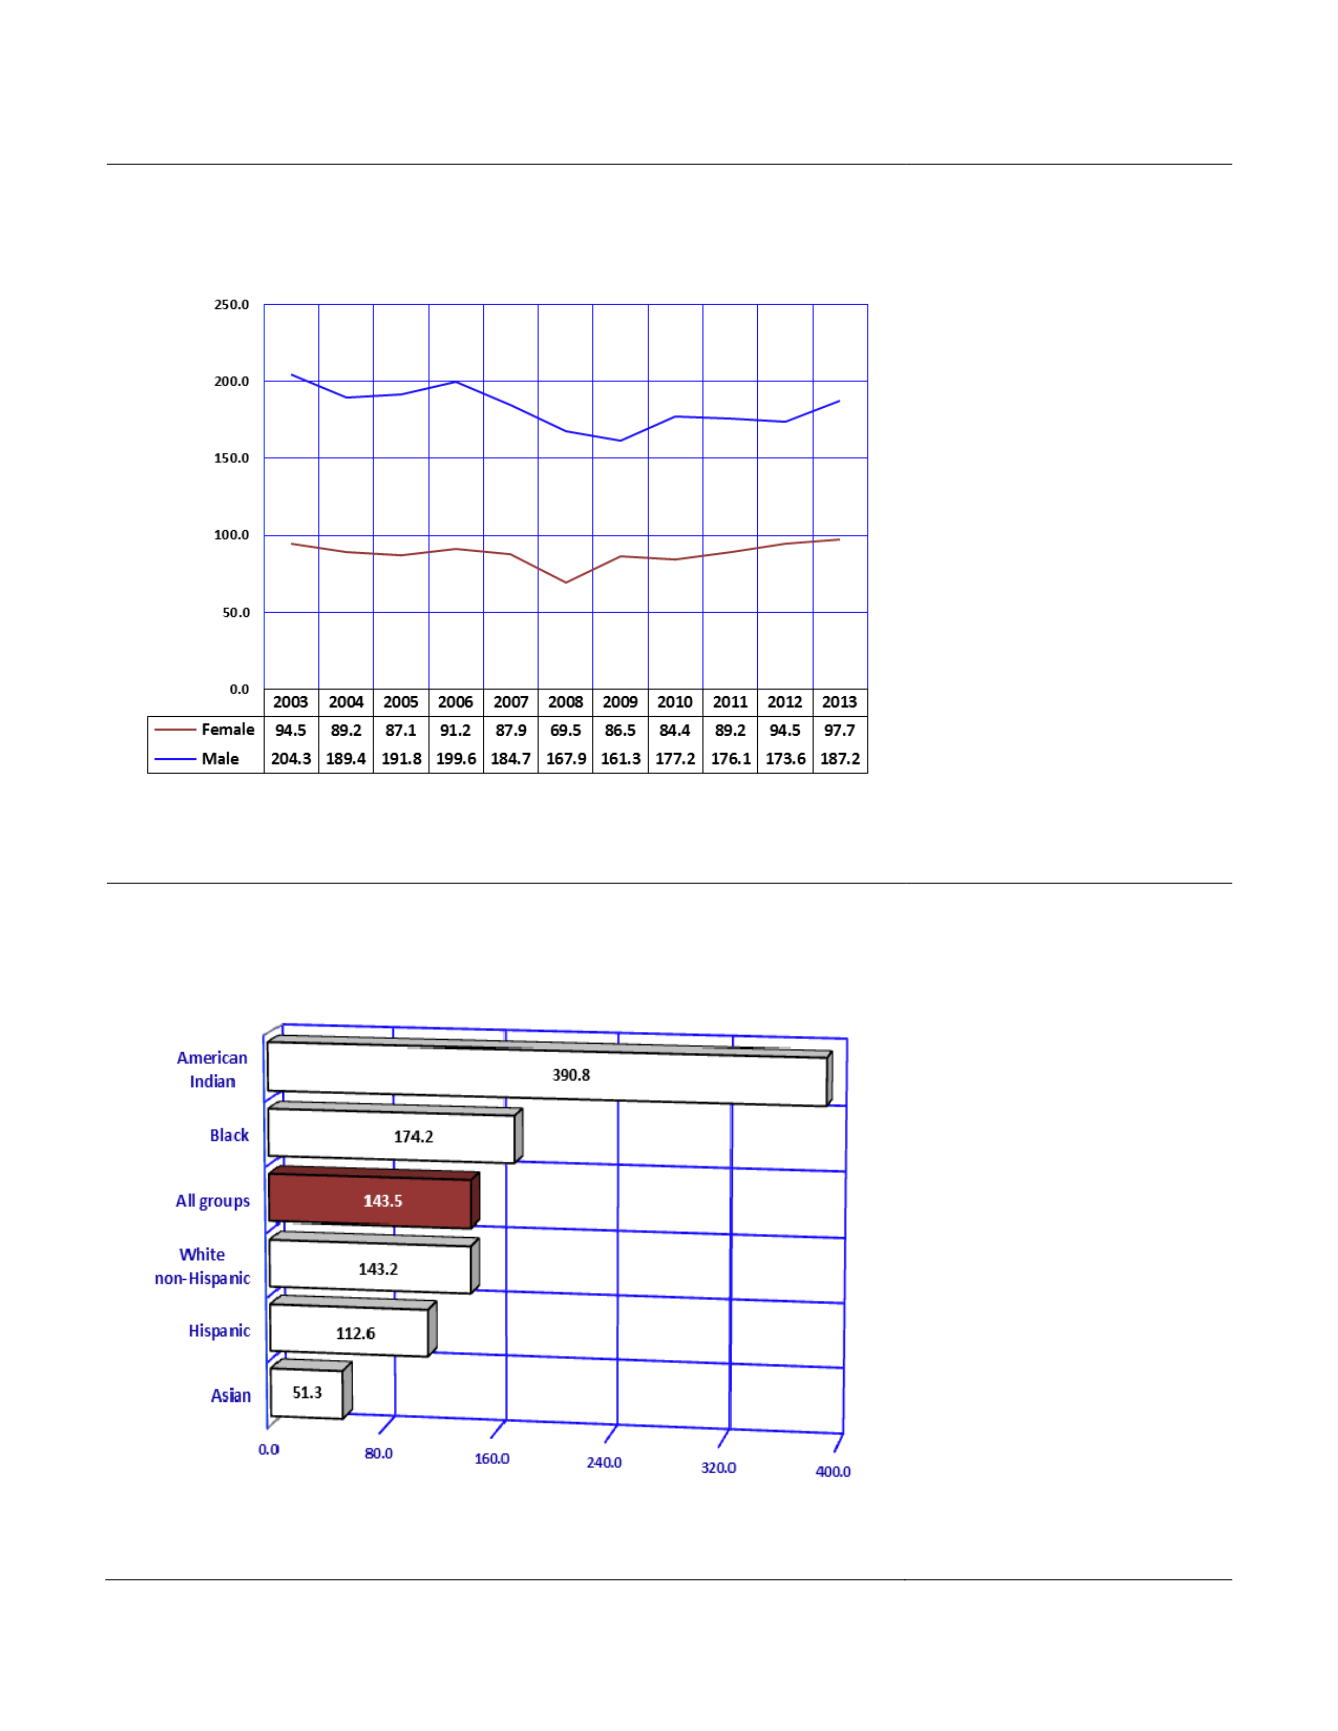
Figure 2C-13
MortalityRates
a
byGender andYear amongYoungAdults 20-44Years,
Arizona, 2003-2013
Notes:
a
Number of deaths per 100,000 persons, 20-44 years old in specified group.
In 2013, 33.0 percent of Arizona
residents were between 20 and
44 years of age. Among the six
developmental periods examined
in the life span, young adulthood,
with an estimated 2.2 million
individuals, easily represented the
largest
segment
of
the
population. However, only one in
sixteen deaths in Arizona (or 6.2
percent) occurred during young
adulthood.
The number of deaths among
young adults in 2003 and 2013
were nearly identical. Since 2008
(n= 2,829), deaths among young
adults have increased 10.1
percent to 3,115 in 2013.
Compared to 2012, the mortality
rate for both male and female
young adults increased, with
mortality among young adult
males increasing 7.8 percent
between 2012 and 2013 (
Figure
2C-13
,
Table 2C-15
).
Figure 2C-14
MortalityRates
a
byRace/Ethnicity amongYoungAdults 20-44Years,
Arizona, 2013
Notes:
a
Number of deaths per 100,000 persons, 20-44 years old in specified group.
The rank order of survival
chances of young adults from
best to worse by race/ethnicity in
2013 was Asian, Hispanic or
Latino, White non-Hispanic, Black
or African American, and
American Indian. American Indian
young adults had a mortality rate
2.2 times greater than Black
young adults, the racial/ethnic
group with the second highest
young adult mortality rate. The
American Indian young adult
mortality rate was 2.7 times
greater than the state average for
young adults and 7.6 times
greater than Asian young adults.
168
Arizona Health Status and Vital Statistics 2013


