2C.AGE-SPECIFICMORTALITY
Middle-aged adultmortality (ages 45-64 years)
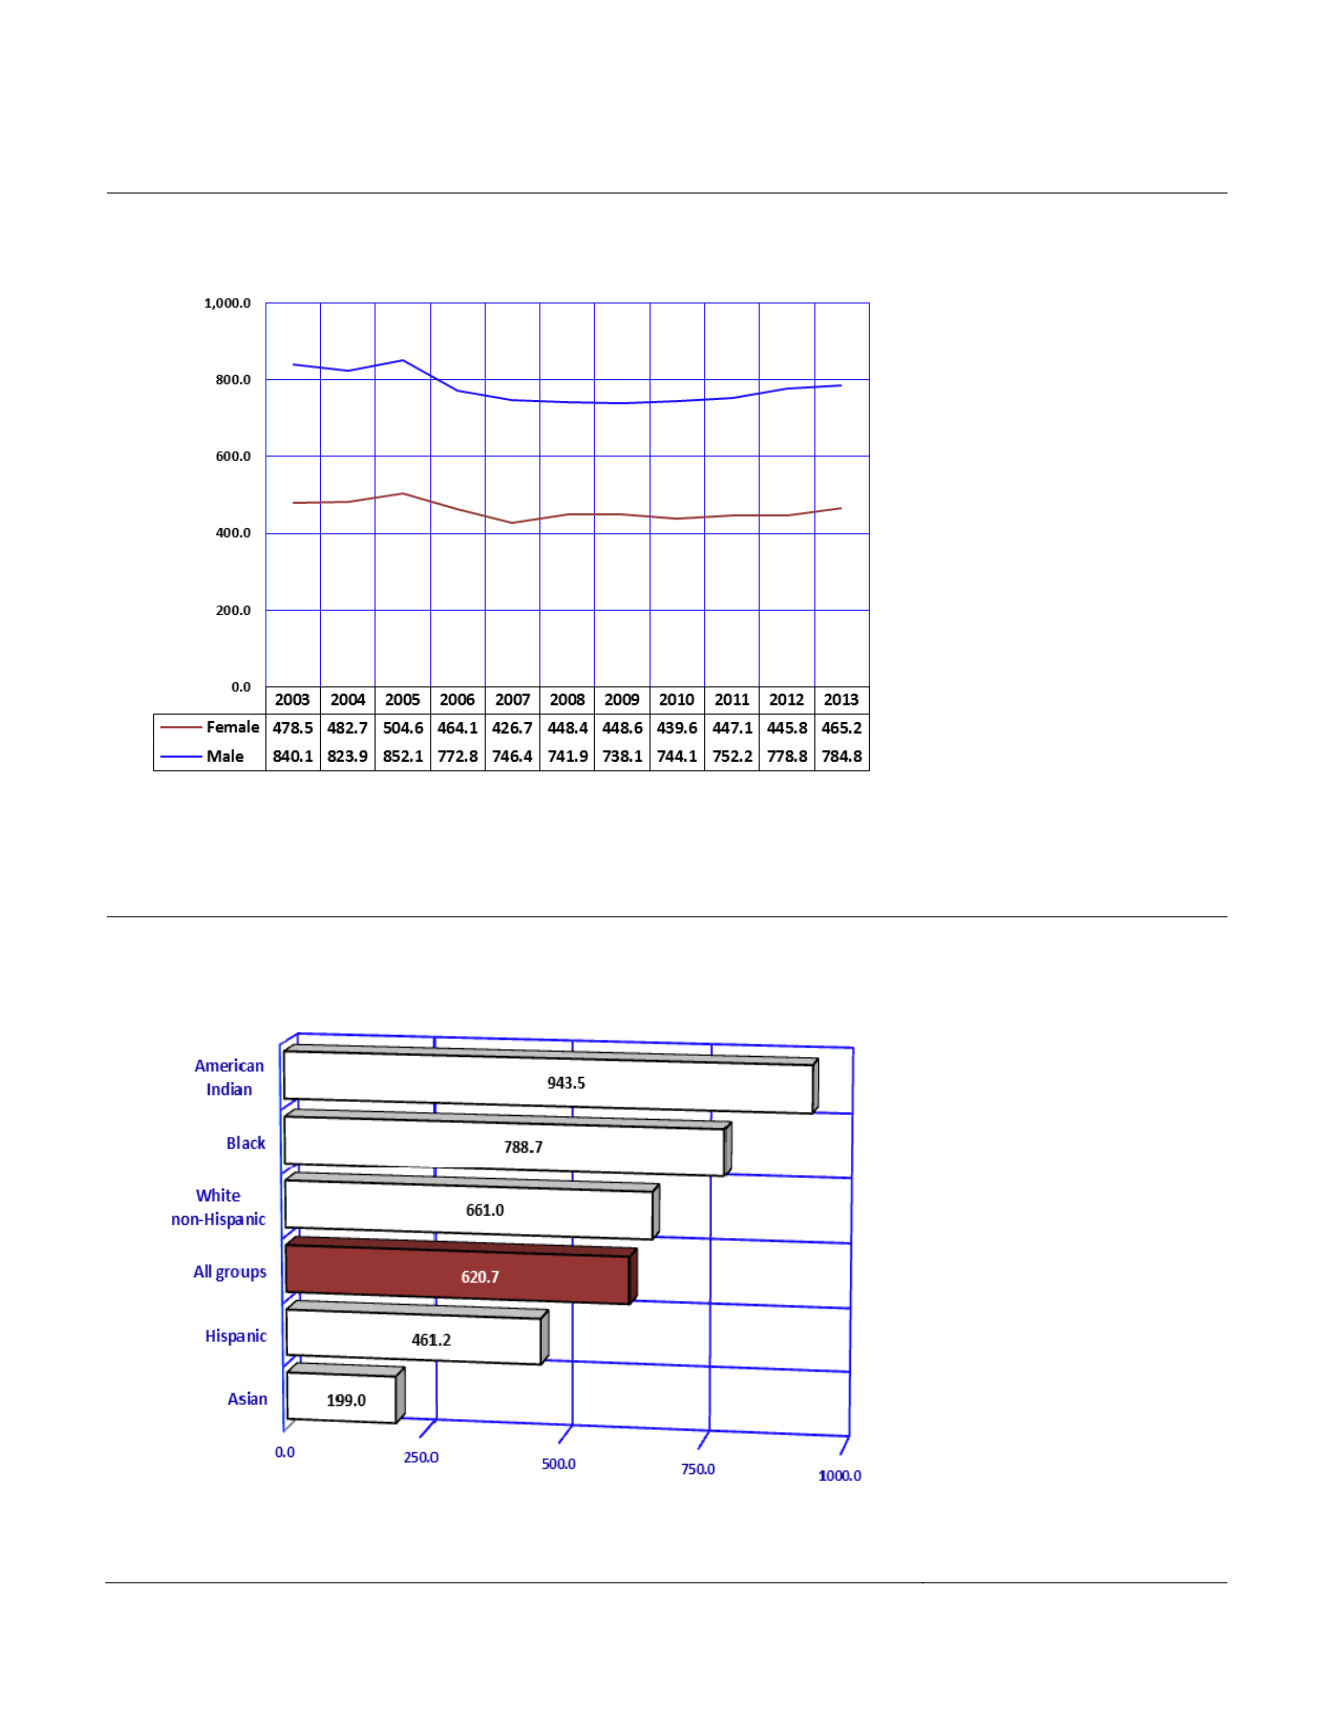
Figure2C-17
MortalityRates
a
byGender andYear amongMiddle-AgedAdults 45-64Years,
Arizona, 2003-2013
Notes:
a
Number of deaths per 100,000 persons, 45-64 years old in specified group.
In 2012, the 1,594,698middle-
aged adult residents aged 45
to 64 experienced 9,898
deaths, or an average of 27
deaths, per day. The total
number of deaths among 45 ?
64 year old Arizona residents
was higher in 2013 (n= 9,898)
than any year since 1980, and
is likely the greatest number of
deaths among this age group
in Arizona?s history (
Table 2C-
19
).
The 2013 total mortality rate
amongmiddle-age females was
2.8 percent lower, and among
middle-aged males 6.6 percent
lower than their respective
rates in 2003 (
Figure 2C-17
,
Table 2C-19
). In 2013, the
mortality rate for males age 45
- 64 was 68.7 percent greater
than for females of the same
age group.
The five causes with the
greatest number of deaths in
2003-2013 were
malignant
neoplasms
,
diseases of heart
,
accidents
,
chronic liver disease
and cirrhosis
, and
chronic
lower respiratory diseases
(
Table2C-19
).
Figure2C-18
MortalityRates
a
byRace/Ethnicity amongMiddle-AgedAdults 45-64Years,
Arizona, 2013
Notes:
a
Number of deaths per 100,000 persons, 45-64 years old in specified group.
American Indian, Black or
African American, and White
non-Hispanic
middle-aged
adults had the three highest
mortality
rates
(943.5/100,000,
788.7/100,000,
and
661.0/100,000, respectively)
among
the
racial/ethnic
groups.
If the 2013 total mortality rate
for Asian middle-aged adults
applied to all Arizona residents
45-64 years old, 3,173 middle-
aged adults would have died
rather than the 9,898 who
actually did.
174
Arizona Health Status and Vital Statistics 2013


