2C.AGE-SPECIFICMORTALITY
Elderlymortality (ages 65 years and older)
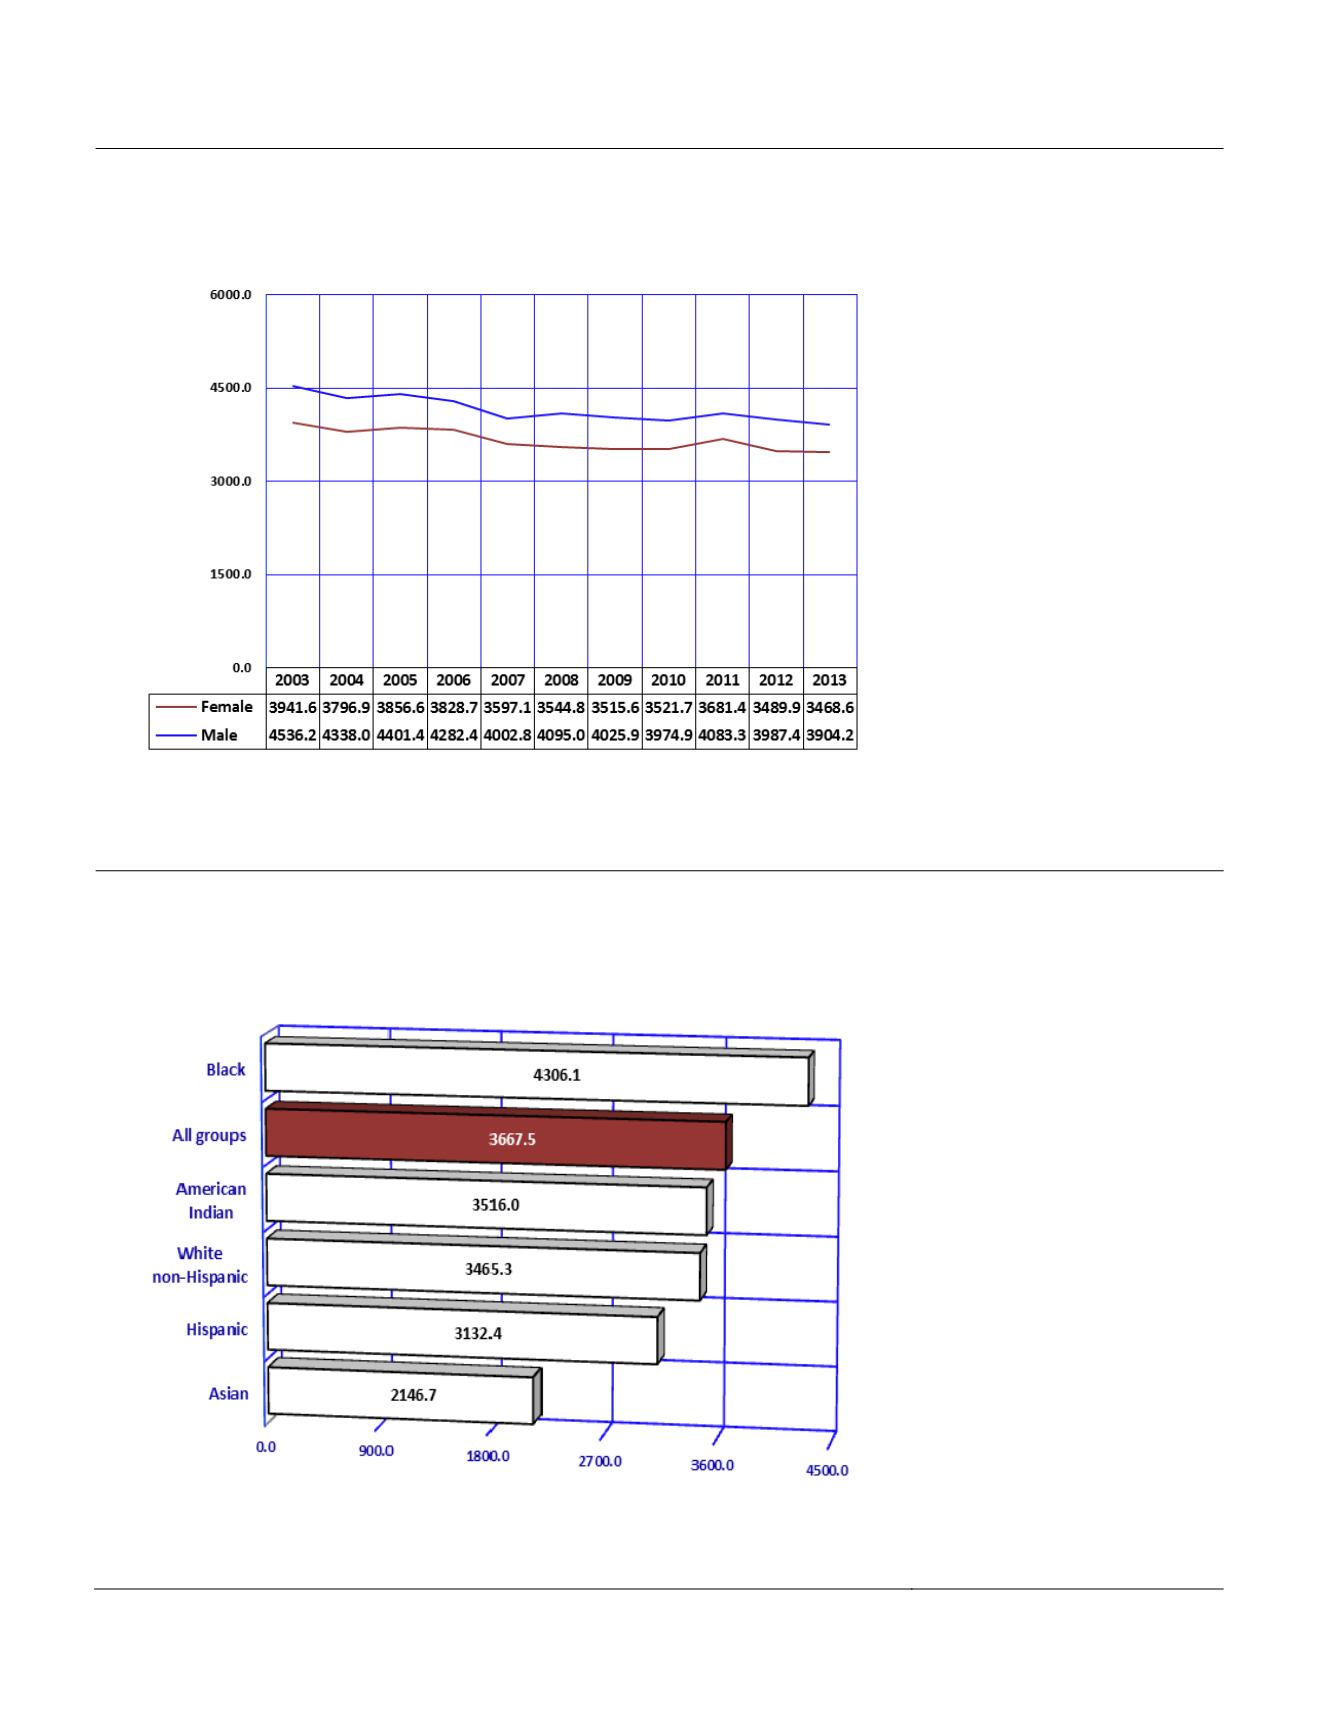
Figure2C-21
MortalityRates
a
byGender andYear amongElderly 65Years andOlder,
Arizona, 2003-2013
Notes:
a
Number of deaths per 100,000 persons, 65+ years old in specified group.
In 2013, an estimated 981,128
residents age 65 years and
older resided in the State
(
Table 10A-1
). No other age
group has as great a
disproportionate
gender
distribution as the elderly. As a
result of the higher total
mortality rates for males at
earlier ages, 19.0 percent more
elderly women than men were
alive in 2013.
The 2013 elderly mortality rate
of 3,667.5 per 100,000 was
12.8 percent lower than the
2003 rate of 4,205.5 and was
the lowest mortality rate among
the elderly since 1980, and
likely the lowest mortality rate
amongst this age group in
Arizona?s history (
Table 2C-
23
).
The 2013 total mortality rate
among elderly females was 12.0
percent lower than their rate in
2003. The mortality rate among
elderly males decreased 13.9
percent during the same period
(
Figure2C-21, Table2C-23
).
Figure2C-22
MortalityRates
a
byRace/Ethnicity amongElderly 65Years andOlder,
Arizona, 2013
Notes:
a
Number of deaths per 100,000 persons, 65+ years old in specified group.
In 2013 the mortality rate for
Arizona?s Black or African
American elderly residents was
2 times that of the Asian elderly
population. Themortality rate of
2,146.7 /100,000 among elderly
Asians was the lowest rate
among the racial/ethnic groups
(
Figure 2C-22
). Hispanic or
Latino elderly had the second
lowest mortality rate in 2013 at
3,132.4/100,000.
180
Arizona Health Status and Vital Statistics 2013


