2D. PATTERNSOF PREMATUREMORTALITY
Figure2D-1
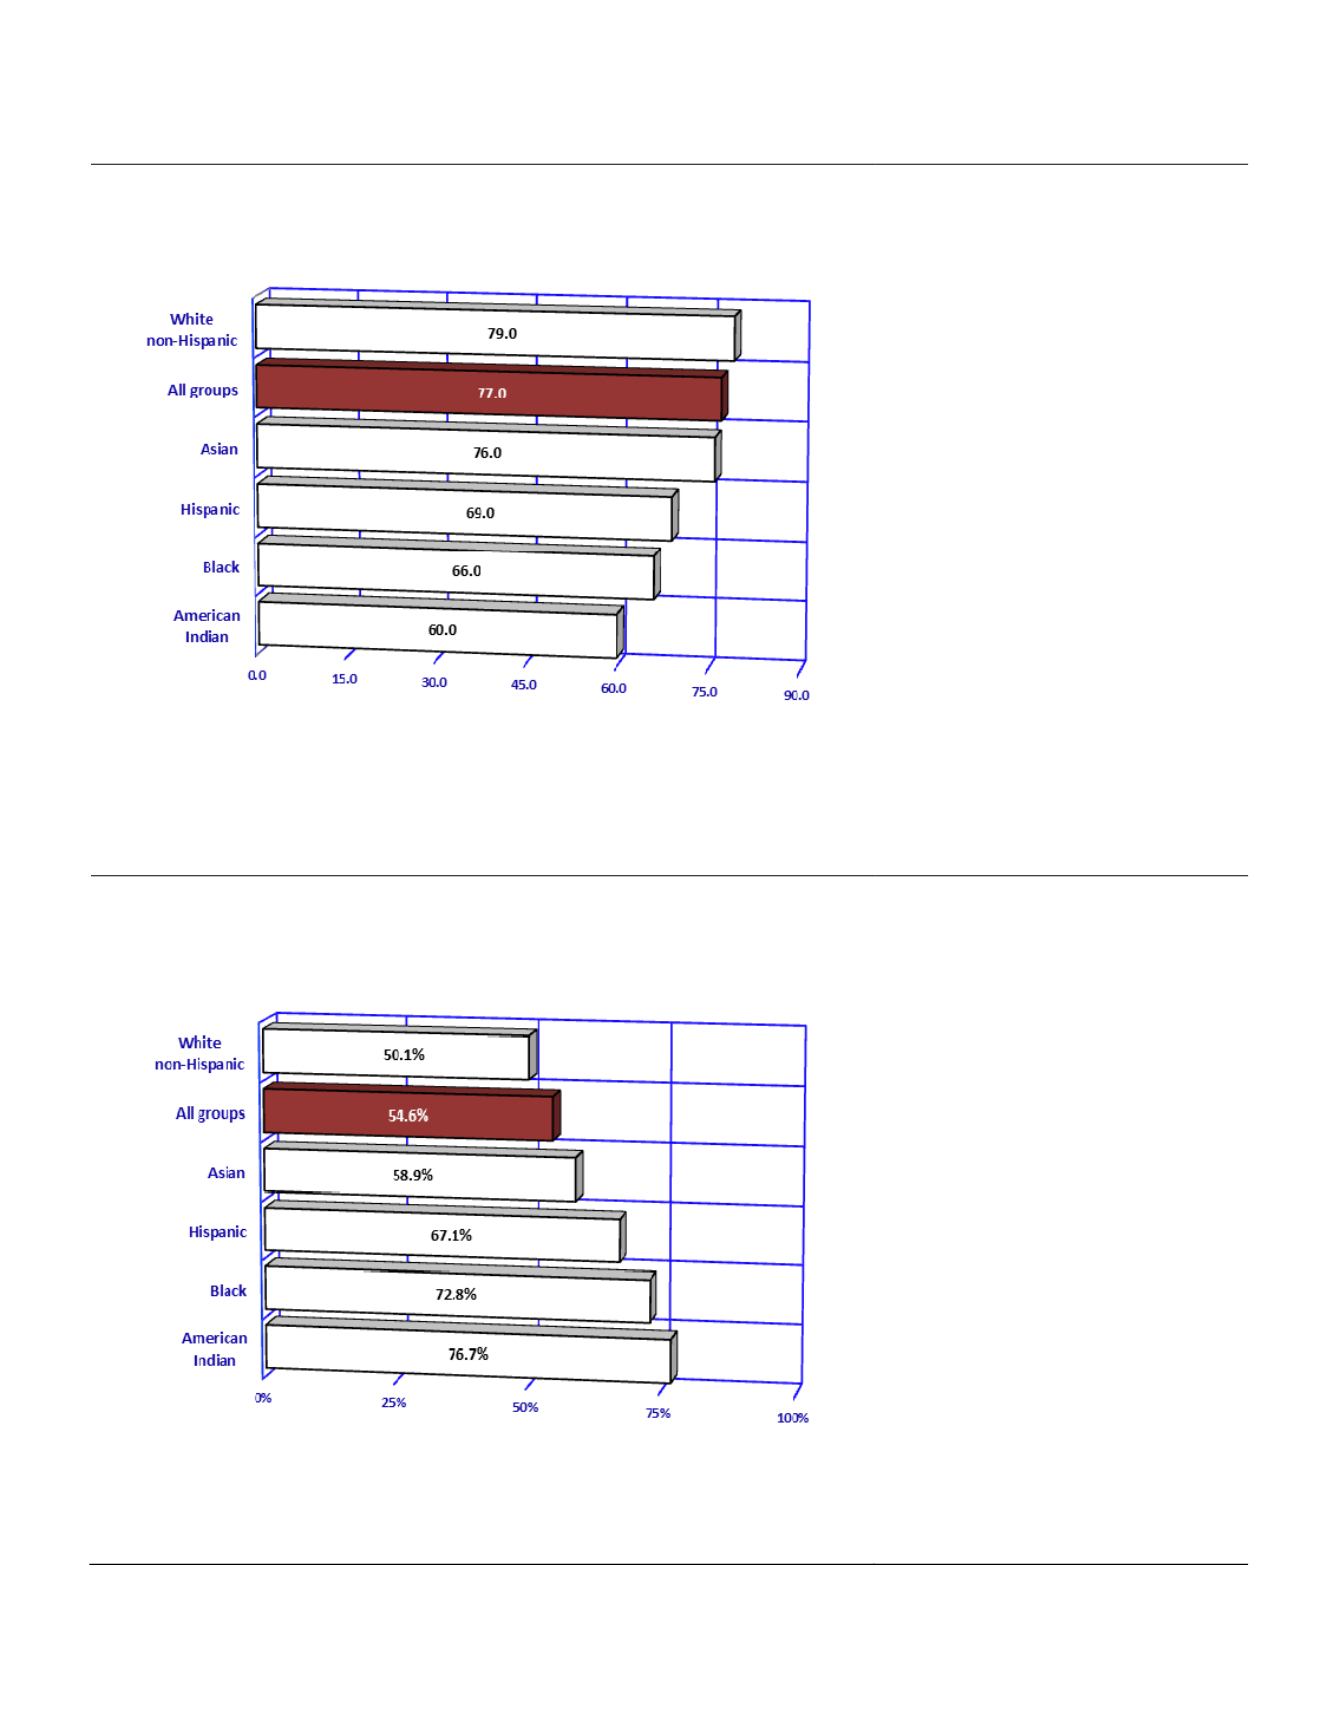
MedianAge at DeathbyRace/Ethnicity, Arizona, 2013
The median age at death remained
stable at 77 years from 2010 to 2013
(
Table 2D-1
). In other words, one of
every two Arizonans who died in 2013
was older than 77 years of age. Among
Arizona females, fifty percent were
older than 80 years when they died in
2013. Amongmales, themedian age at
death was 73 years in 2013.
Table
2D-1
shows both the average and the
median age at death by race/ethnicity
and gender in 2003-2013.
In 2013, compared to White non-
Hispanics, on average Asians were 3
years younger at time of death,
Hispanics were 10 years younger,
Blacks were 13 years younger, and
American Indian residents of Arizona
were 19 years younger (based on the
median age at death).
Figure2D-2
Percent of Deaths before Expected
a
Years of LifeReachedbyRace/Ethnicity,
Arizona, 2013
Notes:
a
Expected years of life at birth for all U.S. residents (78.7 years).
The percent of deaths before expected
years of life reached (a premature
death ratio) slightly decreased for all
Arizonans from 55.0 in 2012 to 54.6 in
2013 (
Figure 2D-2
).
As expected, based on the findings for
average and median age at death,
White non-Hispanics were the only
group with nearly 50 percent of all
deaths (50.1 percent) occurring before
the expected years of life were reached
(
Figure 2D-2
). On average, 68.9
percent of the deaths among
racial/ethnic minority groups occurred
prematurely.
Among American Indians, nearly eight
out of ten deaths (76.7 percent) were
premature (
Table2D
-
2
).
198
Arizona Health Status and Vital Statistics 2013


