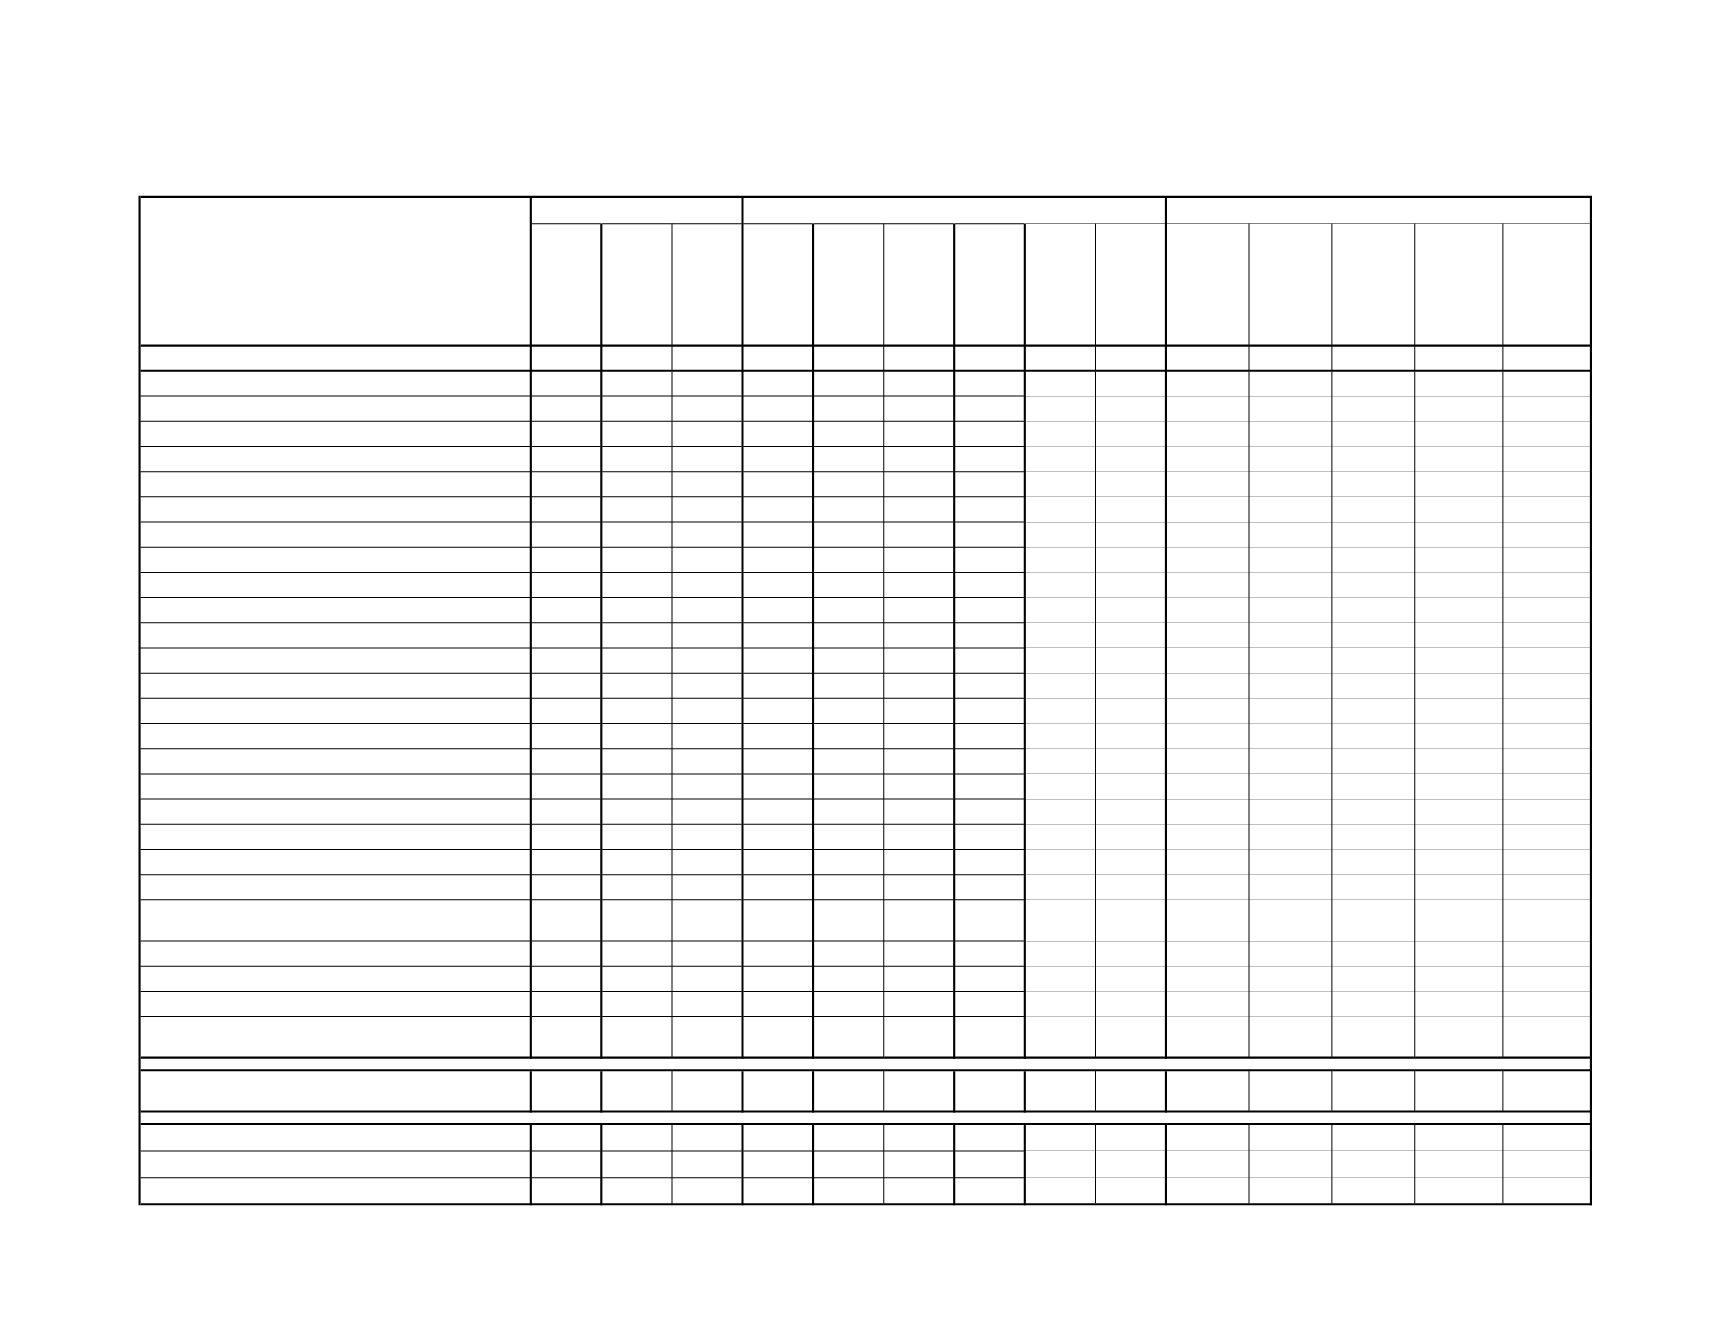
Total, all causes
77.0 74.0 81.0 77.0 73.0 81.0 75.0 72.0 78.0 78.0 69.0 66.0 59.0 75.0
Major cardiovascular diseases
81.0 77.0 85.0 82.0 78.0 85.0 79.0 76.0 84.0 82.0 77.0 70.0 74.0 77.5
Diseases of heart
81.0 77.0 85.0 81.0 77.0 85.0 79.0 75.0 84.0 82.0 75.0 69.0 74.0 78.0
Coronary heart disease
80.0 76.0 85.0 81.0 77.0 85.0 78.0 75.0 83.0 81.0 76.0 71.0 74.0 77.5
Malignant neoplasms
72.0 72.0 72.0 72.0 72.0 73.0 72.0 73.0 72.0 73.0 68.0 67.0 68.0 72.0
Lung cancer
73.0 72.0 73.0 73.0 72.0 74.0 73.0 73.0 73.0 73.0 74.0 69.0 77.5 76.0
Prostate cancer
81.0 81.0 NA 81.0 81.0 NA 81.0 81.0 NA 82.0 79.0 71.5 76.0 78.5
Breast cancer
69.0 70.0 69.0 69.0 70.0 68.0 69.0 0.0 69.0 70.0 62.0 61.0 62.0 56.5
Colorectal cancer
72.0 70.0 75.0 72.0 71.0 74.0 72.0 69.0 76.0 74.0 64.0 64.0 69.0 76.0
Malignantmelanoma of skin
72.0 72.0 72.0 73.0 73.5 72.5 72.0 72.0 71.0 72.0 85.0 55.0
0.0
0.0
Cerebrovascular diseases
82.0 78.0 84.0 82.0 79.0 85.0 82.0 79.0 84.5 84.0 79.0 72.0 74.0 76.5
Chronic lower respiratory diseases
78.0 78.0 79.0 79.0 78.0 80.0 77.0 77.0 78.0 79.0 77.0 71.0 80.0 78.5
Accidents (unintentional injuries)
54.0 51.0 62.0 55.0 51.0 64.0 55.0 51.0 62.0 60.0 44.0 46.5 41.0 67.0
Motor vehicle accidents
45.0 45.0 44.0 44.0 43.5 45.0 45.0 44.0 48.0 52.0 35.5 30.0 30.0 63.5
Falls
85.0 81.0 88.0 86.0 82.0 88.0 84.0 81.0 86.0 86.0 82.0 89.0 55.0 81.0
Accidental poisoning
44.0 42.0 47.0 44.0 42.0 47.0 44.0 42.0 47.0 46.0 40.0 48.0 41.0 29.0
Accidental drowning
36.0 36.0 26.0 29.0 35.0 24.0 47.0 39.0 47.0 47.0 17.0 28.5 30.5 15.0
Influenza andpneumonia
83.0 82.0 85.0 83.0 82.0 85.0 83.0 81.5 84.0 84.0 79.0 81.0 75.5 84.5
Alzheimer's disease
87.0 86.0 88.0 87.0 86.0 88.0 86.0 84.0 87.0 87.0 86.0 84.0 81.0 87.5
Diabetes
71.0 70.0 74.0 71.0 70.0 72.0 72.0 70.0 75.0 73.0 70.0 66.0 62.5 69.0
Intentional self-harm (suicide)
48.0 48.0 49.0 48.0 48.0 49.0 49.0 50.0 46.0 52.0 35.0 29.0 27.0 44.0
Chronic liver disease and cirrhosis
58.0 59.0 58.0 59.0 59.0 58.0 58.0 58.0 57.0 60.5 58.0 57.0 49.0 63.0
Nephritis, nephrotic syndrome and
nephrosis
80.0 79.0 82.0 81.0 81.0 82.0 79.0 76.5 82.0 82.0 69.0 75.0 70.0 83.0
Septicemia
76.0 76.0 76.0 76.0 76.0 76.0 74.0 73.0 80.0 77.0 75.0 83.0 67.5 71.0
Assault (homicide)
33.0 33.0 36.0 32.0 31.0 36.0 36.0 35.5 38.0 43.5 25.0 30.5 31.0 41.0
Parkinson's disease
82.0 82.0 83.0 83.0 82.0 83.0 82.0 82.0 82.0 83.0 83.0 73.5 80.5 77.0
Essential (primary) hypertension and
hypertensive renal disease
81.0 78.0 83.0 81.0 79.0 83.0 78.5 75.0 81.0 83.0 78.0 72.5 68.0 76.0
Human immunodeficiency virus (HIV)
disease
49.0 48.0 56.0 49.0 47.5 54.0 49.0 49.0 47.0 53.0 46.5 49.5 48.0
0.0
INJURYBY FIREARMS
45.0 45.0 49.0 43.0 43.0 44.0 53.0 52.0 54.0 52.0 28.5 29.0 37.0 40.0
DRUG-INDUCEDDEATHS
47.0 45.0 48.0 47.0 45.0 48.0 47.0 44.0 48.5 48.0 41.0 47.5 39.0 29.0
ALCOHOL-INDUCEDDEATHS
56.0 56.0 53.0 57.0 57.0 53.0 53.0 54.0 51.0 58.0 55.0 61.0 47.0 53.0
TABLE2D-3
MEDIANAGEATDEATH FOR LEADINGCAUSESOFMORTALITYBYGENDER, RACE/ETHNICITY, AND
URBAN/RURALAREAS
a
, ARIZONA, 2013
ARIZONA
Area/gender
Race/ethnicity
Total
Male
Female
Notes:
a
Urban=Maricopa, Pima, Pinal, and Yuma counties;median age at death= themiddle of the age distribution: half died at age greater than themedian and half at age below the
median.
WhiteNon-
Hispanic
Hispanic or
Latino
Black or
African
American
American
Indian or
Alaska
Native
Asian or
Pacific
Islander
Total Urban
UrbanMale
Urban
Female
Total Rural
Rural
Male
Rural
Female
202
Arizona Health Status and Vital Statistics 2013


