1A. PREGNANCIES BY PREGNANCY OUTCOME, ETHNICITY, AND AGE GROUP
Figure1A-5
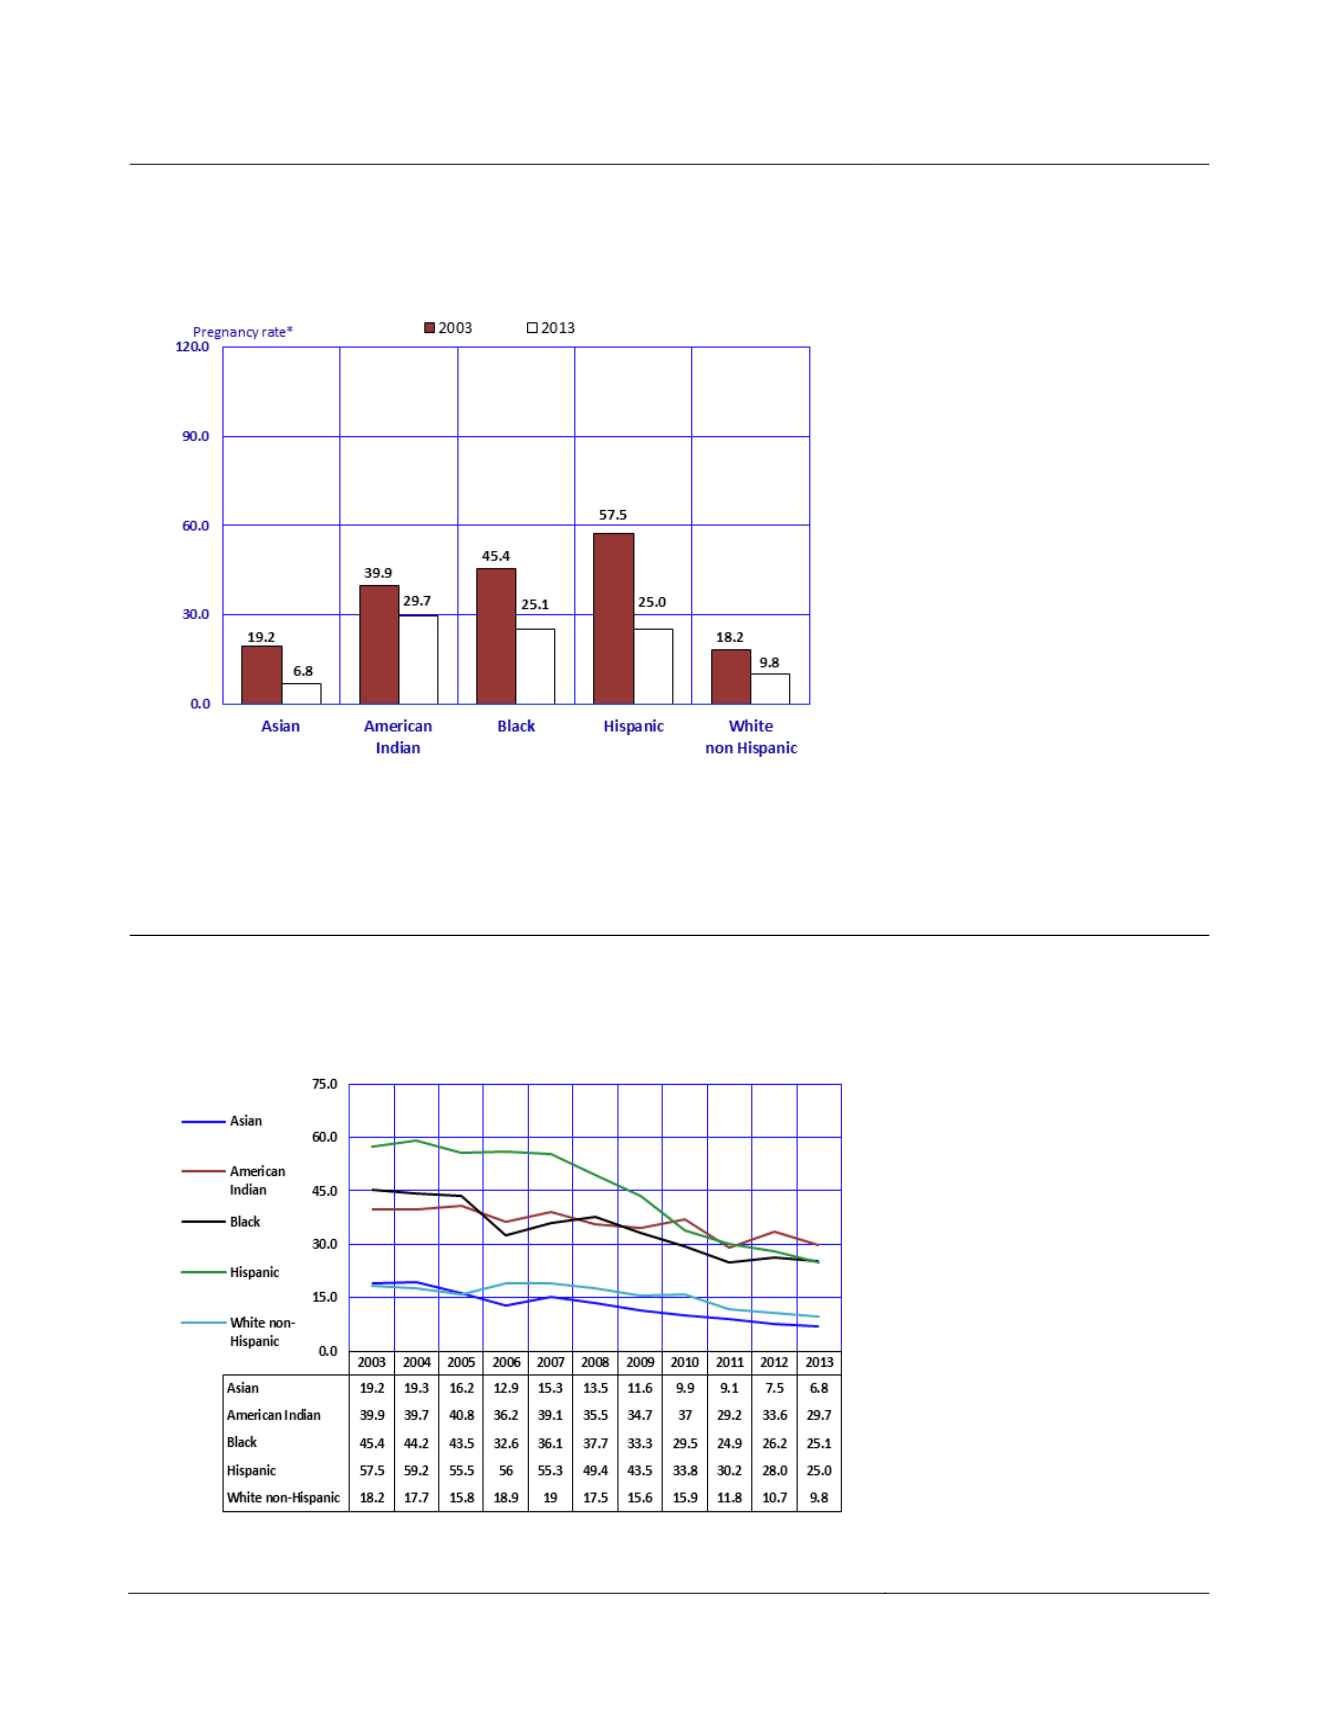
Comparisonof PregnancyRates
a
byRace/Ethnicity andYear among
Females 19or Younger inArizona, 2003, and2013
Note:
a
All rates per 1,000 females in specified age group.
Teen pregnancy rates differ by
race/ethnicity.
Between 2003 and 2013,
pregnancy rates among females
aged 19 and younger declined for
all racial/ethnic groups (
Figure
1A-5
). The steepest decline in
teenage pregnancy rates was
recorded for Asian females, who
experienced a 64.6 percent drop
from 2003 to 2013. The Hispanic
teenage pregnancy rate decreased
56.5 percent from 57.5 in 2003 to
25.0 in 2013, representing amuch
larger decline in the absolute
number of pregnant teenage
Hispanics compared to Asians.
The changes in annual teen
pregnancy rates from 2003 to
2013 are shown in detail below.
Figure1A-6
PregnancyRates
a
byRace/Ethnicity andYear among Females
19or Younger, Arizona, 2003 - 2013
Note:
a
All rates per 1,000 females in specified age group.
The teen pregnancy rates for all
racial/ethnic groups were lower in
2013 than in 2003 (
Figure 1A-6).
Compared to 2012, the teen
pregnancy rate decreased for all
racial/ethnic groups.
From 2012 to 2013, teenage
pregnancy rates decreased 11.6
percent for American Indian
females, 10.7 percent for Hispanic
or Latino females, 9.3 percent for
Asian or Pacific Islander females,
8.4 percent among White non-
Hispanic females, and 4.2 percent
for Black or African American
females.
8
Arizona Health Status and Vital Statistics 2013


