1B. NATALITY: MATERNAL CHARACTERISTICS ANDNEWBORN?SHEALTH
Figure1B-1
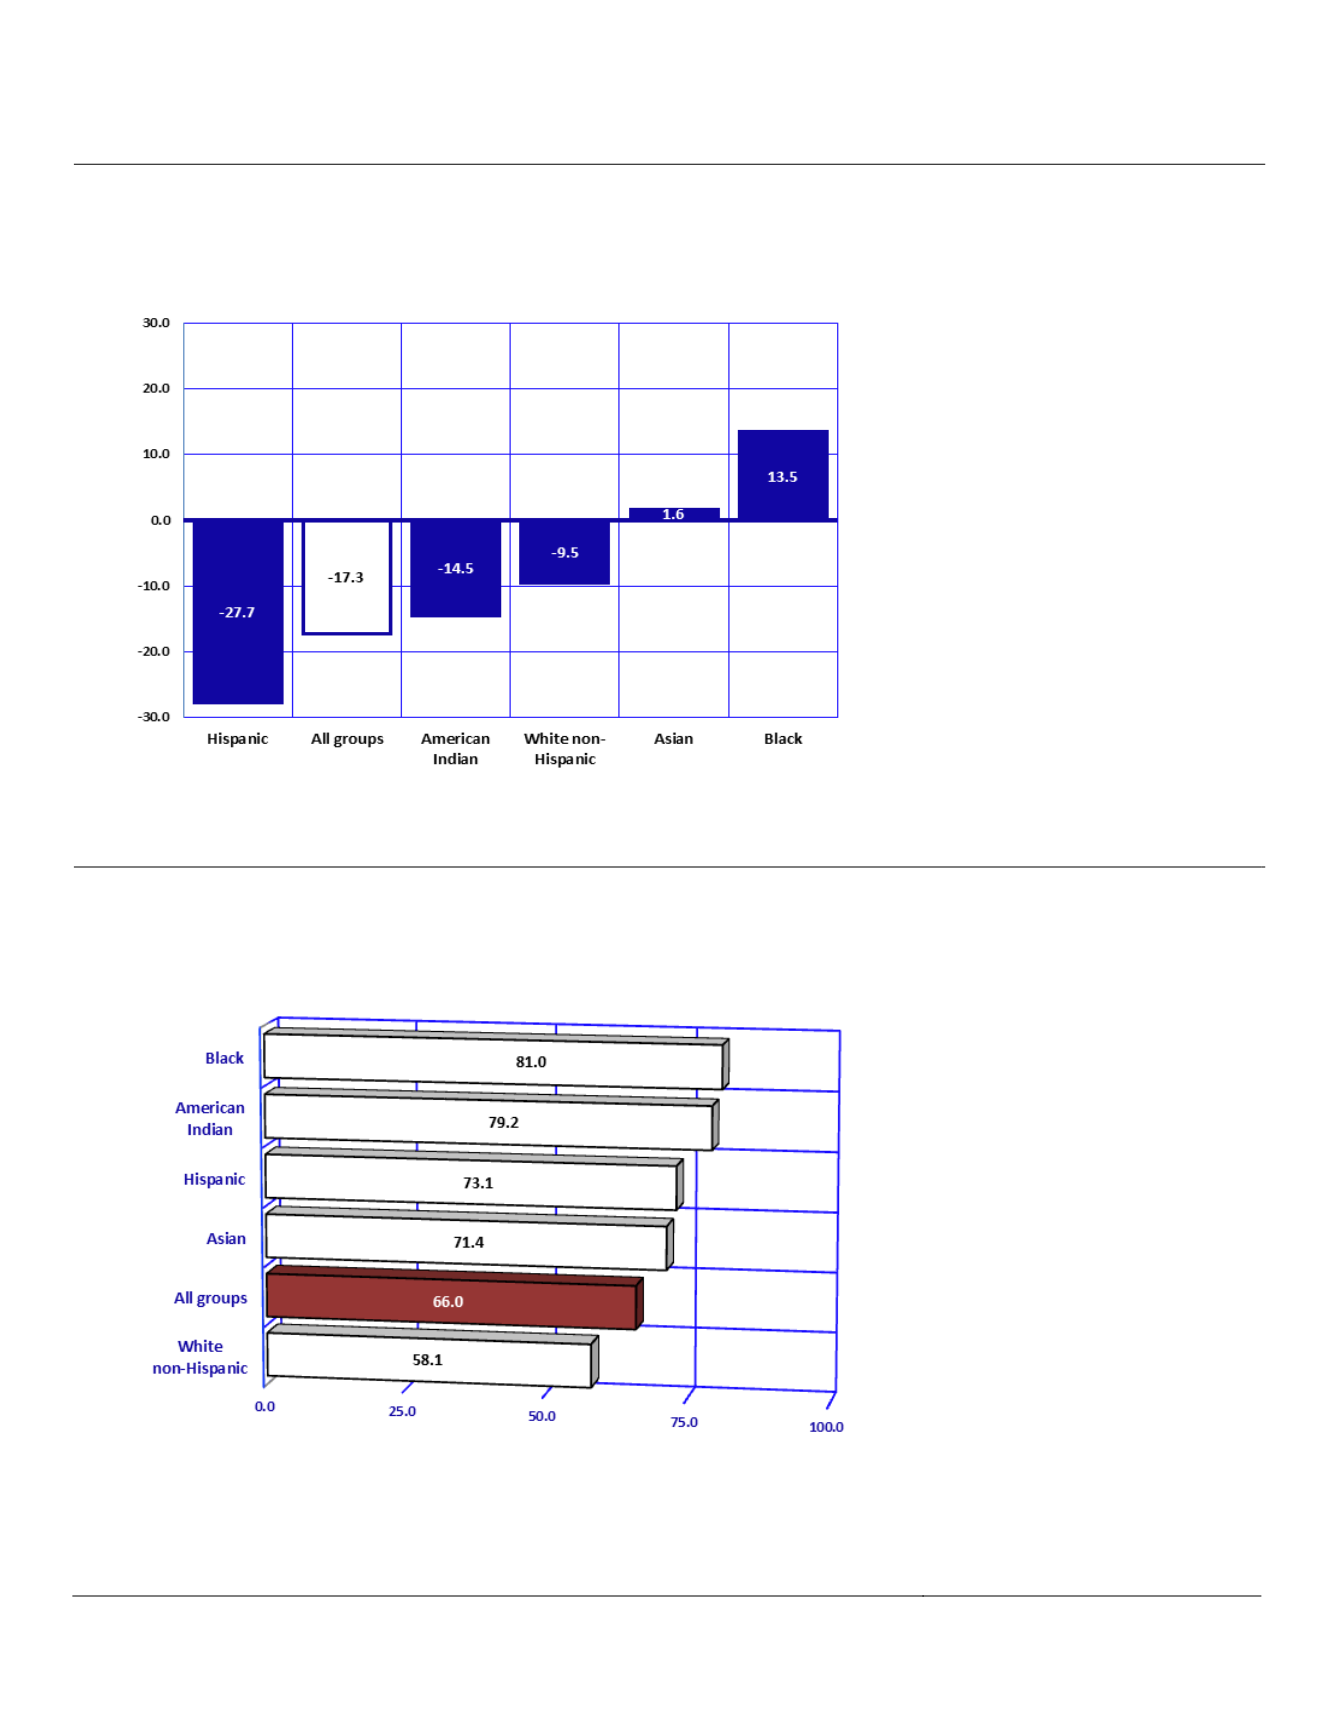
Percent Change from2007 to2013 in theNumber of Resident LiveBirths by
Mother?sRace/Ethnicity, Arizona
From 2007 to 2013, the number
of resident live births declined by
17.3 percent (
Figure 1B-1
).
The magnitude of the reduction
in the number of births was the
largest among Hispanics or
Latinos (-27.7 percent) and
American
Indians
(-14.5
percent).
Racial/ethnic
groups
that
represent a relatively small
proportion
of
Arizona?s
population have seen increases
in the number of live births from
2007 to 2013. Both Asian (1.6
percent) and Black (13.5
percent) resident mothers had a
greater number of live births in
2013 than in 2007.
Figure1B-2
General FertilityRates
a
byRace/Ethnicity among Females of all Ages,
Arizona, 2013
Note:
a
Number of births per 1,000 females 15-44 years old in specified group.
From among 1,286,456
women of childbearing age
(15-44 years), 6.6 percent
gave birth in 2013. The
general fertility rate
(the
number of births per 1,000
women 15-44 years old;
GFR) was the highest for
Black or African American
females,
followed
by
American Indian, Hispanic,
and Asian females. The GFR
for White non-Hispanic
females was the lowest of all
racial/ethnic groups.
A comparison of fertility
rates by county in Arizona is
provided in
Table5A-1
.
18
Arizona Health Status and Vital Statistics 2013


