1B. NATALITY: MATERNAL CHARACTERISTICS ANDNEWBORN?SHEALTH
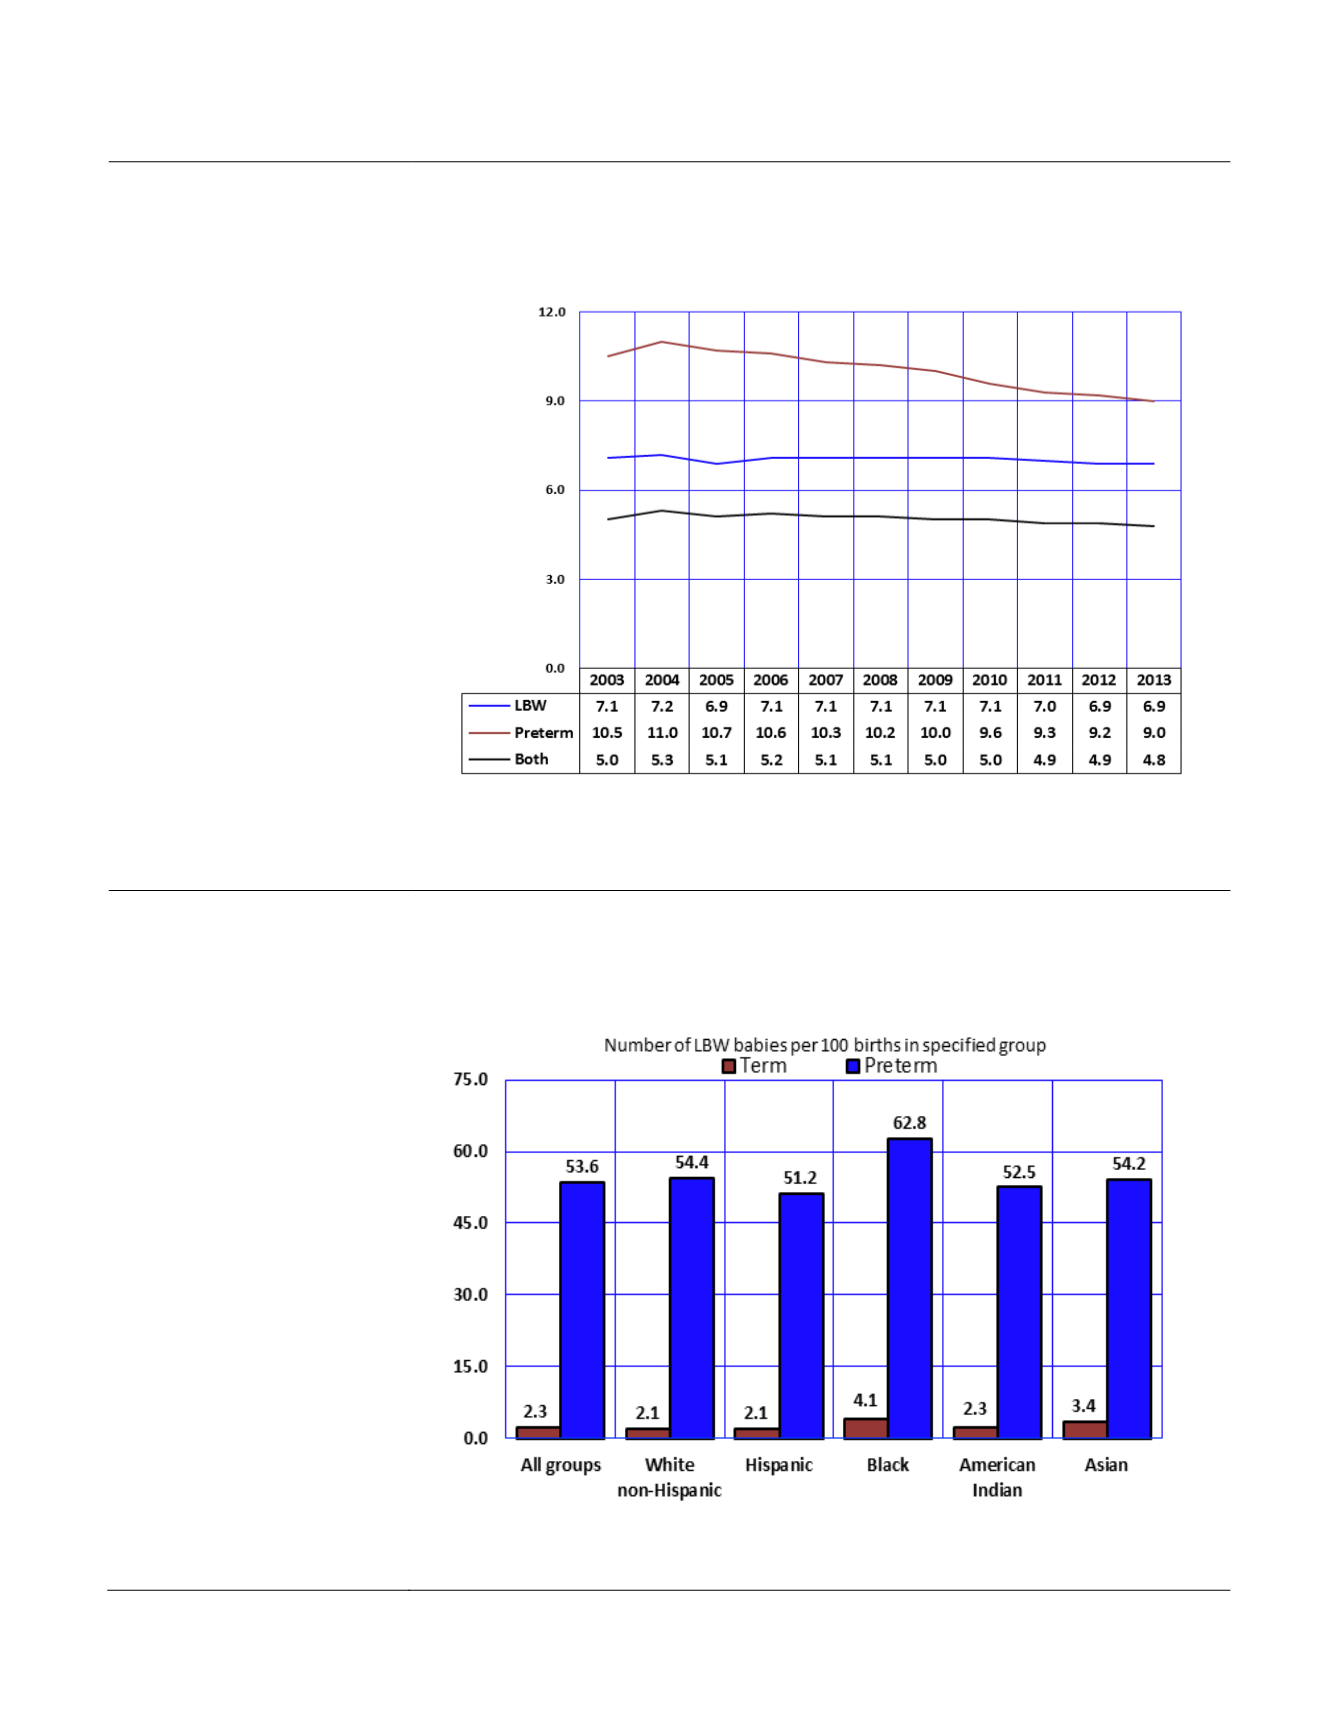
The proportion of preterm
births decreased from 9.2
percent of all births in 2012 to
9.0 percent in 2013.
The proportion of infants born
earlier than expected who
were also low birth weight
(LBW; at less than 2,500
grams) was 4.8/100 births in
2013 (
Figure 1B-11
).
Detailed characteristics of
births by birthweight and
gestational age are provided in
Table 1B-33.
Comparative
data by county of residence
are available in
Table 5B-16?
Table5B-24
.
Figure 1B-11
Preterm
a
and LowBirthweight (LBW)
b
Births byYear,
Arizona, 2003-2013
Notes:
a
Preterm: < 37 weeks of gestation;
b
Low birthweight (less than 2,500 grams or 5 pounds 8 ounces); In this report, the primary
measure used to determine the gestational age is the clinical estimate of gestation as reported on the birth certificate.
From 2003 to 2013, between
6.8 and 7.2 percent of all
babies were born at low
birthweight (LBW), or at less
than 2,500 grams (5 pounds 8
ounces). Preterm delivery is
the strongest risk factor for
LBW. Infants born at less than
37 completed weeks of
gestation were 23.3 times
(53.6 vs. 2.3 percent) more
likely to be LBW than infants
born at term (
Figure 1B-12
).
Seven out of ten (70.2
percent) LBW babies born in
2013were preterm (
Table 1B-
3
).
County-level data for LBW
newborns are available in
Tables
5B-16
?
5B-23
.
Community-level information is
in
Table9A
Figure 1B-12
Low-Birthweight (LBW) Births by Lengthof Gestation andMother?s
Race/Ethnicity, Arizona, 2013
Notes: Number of LBW babies per 100 births in specified group; Preterm: < 37weeks of gestation; Low birthweight (less than 2,500
grams or 5 pounds 8 ounces).
Arizona Health Status and Vital Statistics 2013
23


