


 36 / 96

Vaginal Vaginal after
C-Section
Primary
C-Section
Repeat
C-Section Forceps Vacuum
5,480† 4,040†
110†
630†
680†
20†
80†
Ak-Chin Indian Community
20
14
0
6
0
0
0
Cocopah Tribe
19
13
0
*
*
0
0
Colorado River Indian Tribe
57
42
0
7
8
0
0
Fort McDowell Yavapai Nation Reservation
21
14
0
*
*
0
0
Fort Mohave Indian Tribe
*
0
0
*
*
0
0
Gila River Indian Community
60
42
*
10
7
0
0
Havasupai Tribe
9
7
0
0
*
0
0
Hopi Tribe
168
125
6
24
13
*
*
Hualapai Tribe
27
18
0
*
7
*
*
Navajo Nation
1,331 1,053
52
109
110
9
11
Pascua Yaqui Tribe
65
50
*
7
*
0
0
Salt River Pima-Maricopa Indian Community
100
54
*
18
26
*
0
San Carlos Apache Tribe
286
206
*
29
49
0
11
San Xavier
19
14
0
*
*
0
0
Tohono O'Odham Nation
144
113
*
12
15
0
0
White Mountain Apache Tribe
280
210
0
36
34
0
7
Yavapai-Apache Nation
17
13
0
*
0
0
0
Yavapai-Prescott Indian Tribe
*
*
0
0
*
0
0
TOTAL
2,630† 1,990†
70†
270†
290†
10†
30†
---in Maricopa County
1,557 1,103
23
207
221
*
28
---in Pima County
307
224
7
34
42
0
11
---in Coconino County
217
170
*
20
25
0
*
---elsewhere in Arizona
763
555
9
97
102
*
6
TOTAL
2,840† 2,052
40†
358
390
10†
50†
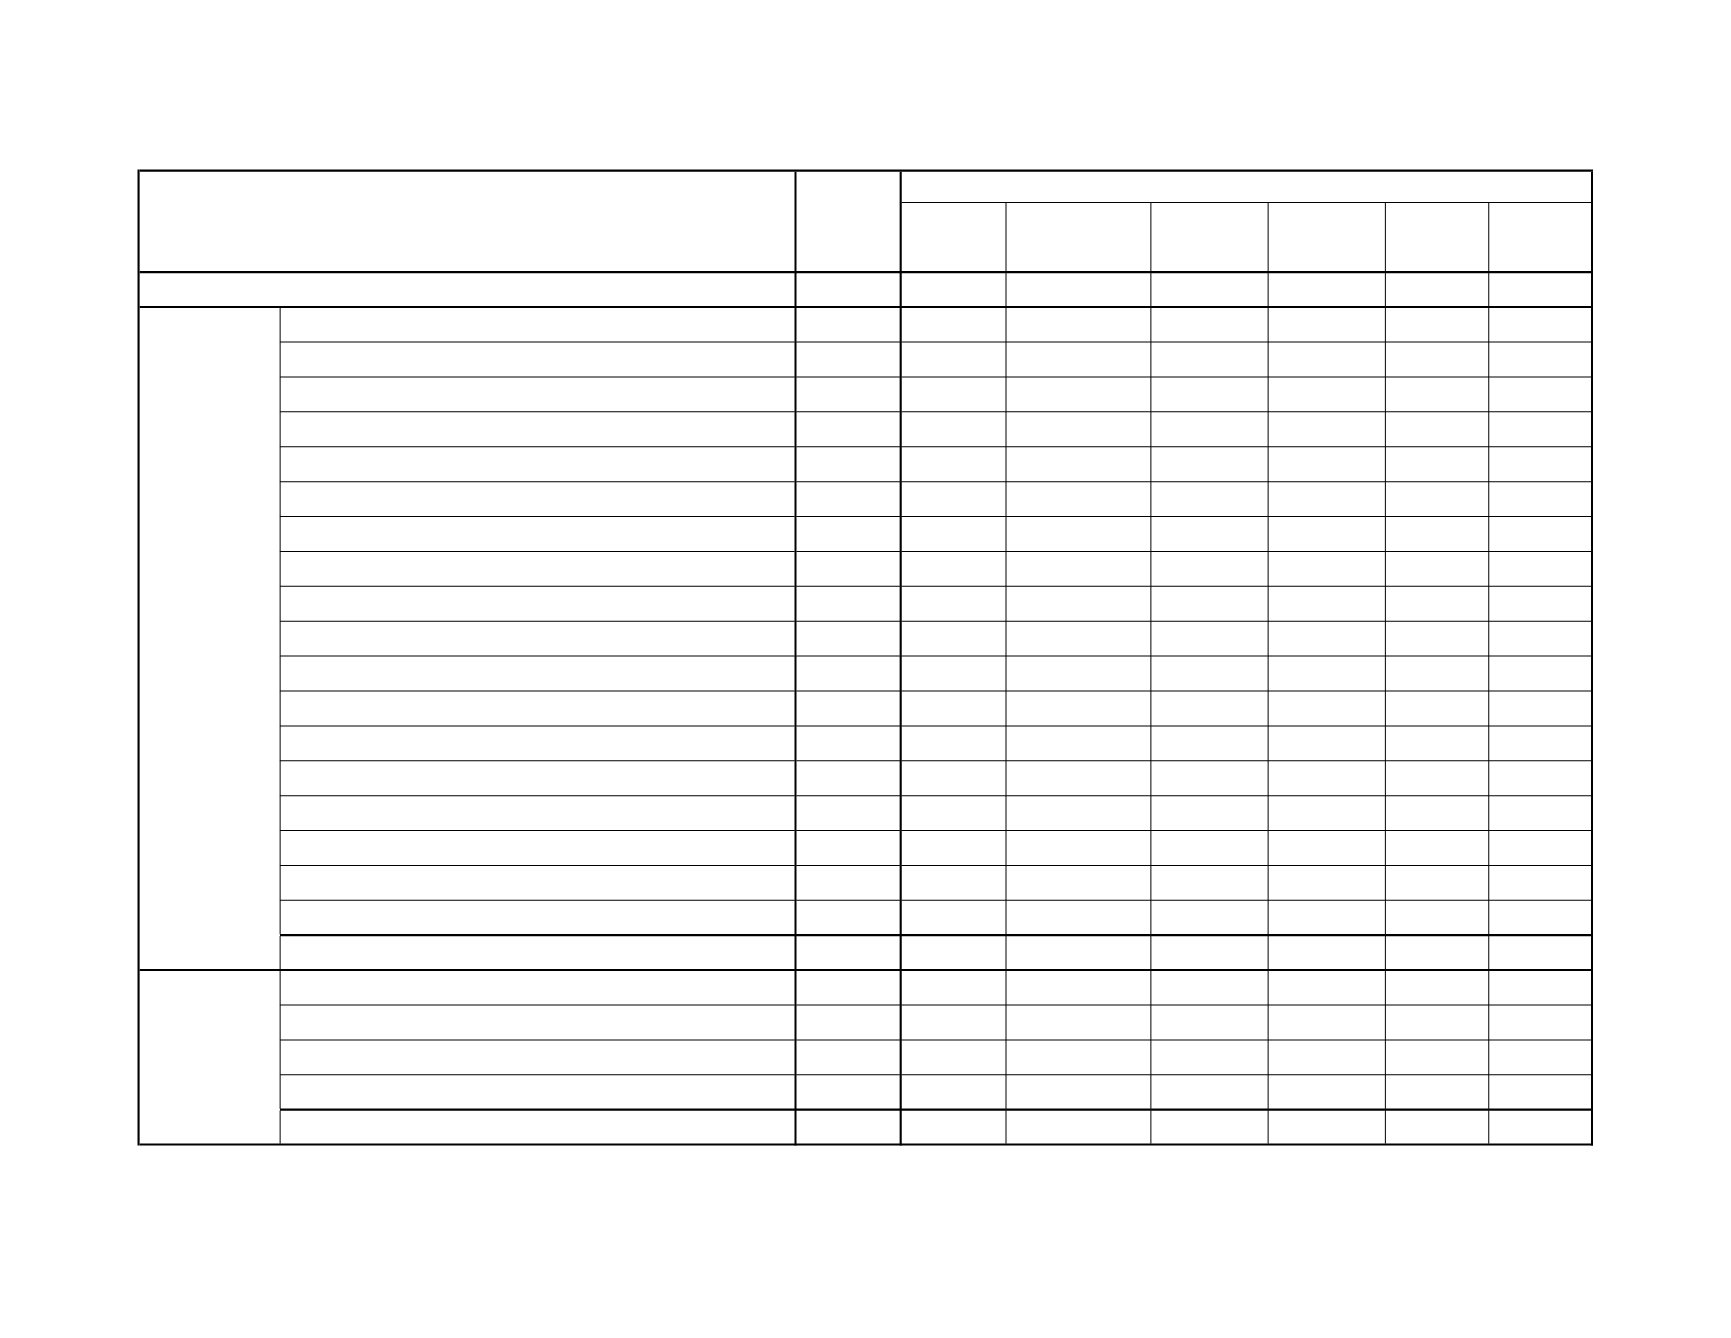
Method of delivery
a
4.14
METHOD OF DELIVERY (2013 STATUS)
TOTAL
BIRTHS
Notes: * Cell suppressed due to non-zero count less than 6; † Sum rounded to nearest tens unit due to non-zero addend less than 6;
a
Method of delivery does not sum to the number of
total births as each birth may be associated with multiple methods of delivery.
ALL AMERICAN INDIAN RESIDENTS OF ARIZONA
Resided on
reservation
Resided off
reservation
36
Health Status Profile of American Indians in Arizona, 2013 Data Book