


 52 / 96

<1
1-4
5-14
15-24
25-34
35-44
45-54
55-64
65-74
75-84
85+
Unknown
1,960† 40† 20† 20† 90† 170† 210† 280† 310† 260† 310† 0†
0
Ak-Chin Indian Community
10†
*
*
*
0
0
*
*
*
0
0
*
0
Cocopah Tribe
10†
0
0
0
0
0
0
*
*
*
*
0
0
Colorado River Indian Tribe
30†
0
*
0
0
*
*
*
9
6
6
0
0
Fort McDowell Yavapai Nation Reservation
10†
0
0
0
*
0
*
0
*
*
*
0
0
Fort Mojave Indian Tribe
0†
0
0
0
0
*
0
0
0
0
0
0
0
Gila River Indian Community
20†
*
0
0
0
*
*
*
*
*
*
*
0
Havasupai Tribe
10†
0
0
0
0
*
*
*
*
*
*
*
0
Hopi Tribe
50†
*
0
0
*
*
*
* 13
* 13
9
0
Hualapai Tribe
50†
*
0
0
0
*
*
*
7
9
6 14
0
Navajo Nation
370†
6
6
* 24 39 39 63 51 41 59 42
*
Pascua Yaqui Tribe
300†
*
*
* 11 13 23 22 32 35 74 81
0
Salt River Pima-Maricopa Indian Community
350†
7
0
*
9 28 35 49 63 59 61 33
0
San Carlos Apache Tribe
60†
*
*
0
*
*
*
8 10 10
*
*
0
San Xavier
30†
0
0
0
*
0
*
*
6
8
*
*
0
Tohono O'Odham Nation
90†
0
*
*
*
* 10 12 21 12 11
8
0
White Mountain Apache Tribe
70†
*
*
* 10 11
9 11
6
*
8
*
0
Yavapai-Apache Nation
50†
*
*
0
*
*
6
6
7
* 10
7
0
Yavapai-Prescott Indian Tribe
40†
*
*
0
*
6
7
*
*
7
6
*
0
TOTAL
1,520† 30† 20† 10† 70† 120† 160† 200† 240† 200† 270† 210† 0†
---in Maricopa County
150†
*
0
*
7 15 27 39 23 10 10
8
0
---in Pima County
70†
*
0
0
*
*
* 11 17 13 10
*
0
---in Coconino County
40†
*
0
0
*
*
*
*
*
*
7
*
0
---elsewhere in Arizona
180†
*
*
*
8 23 14 28 32 32 20 20
0
TOTAL
430† 10† 0† 10† 20† 50† 50† 80† 80† 60† 47 30†
0
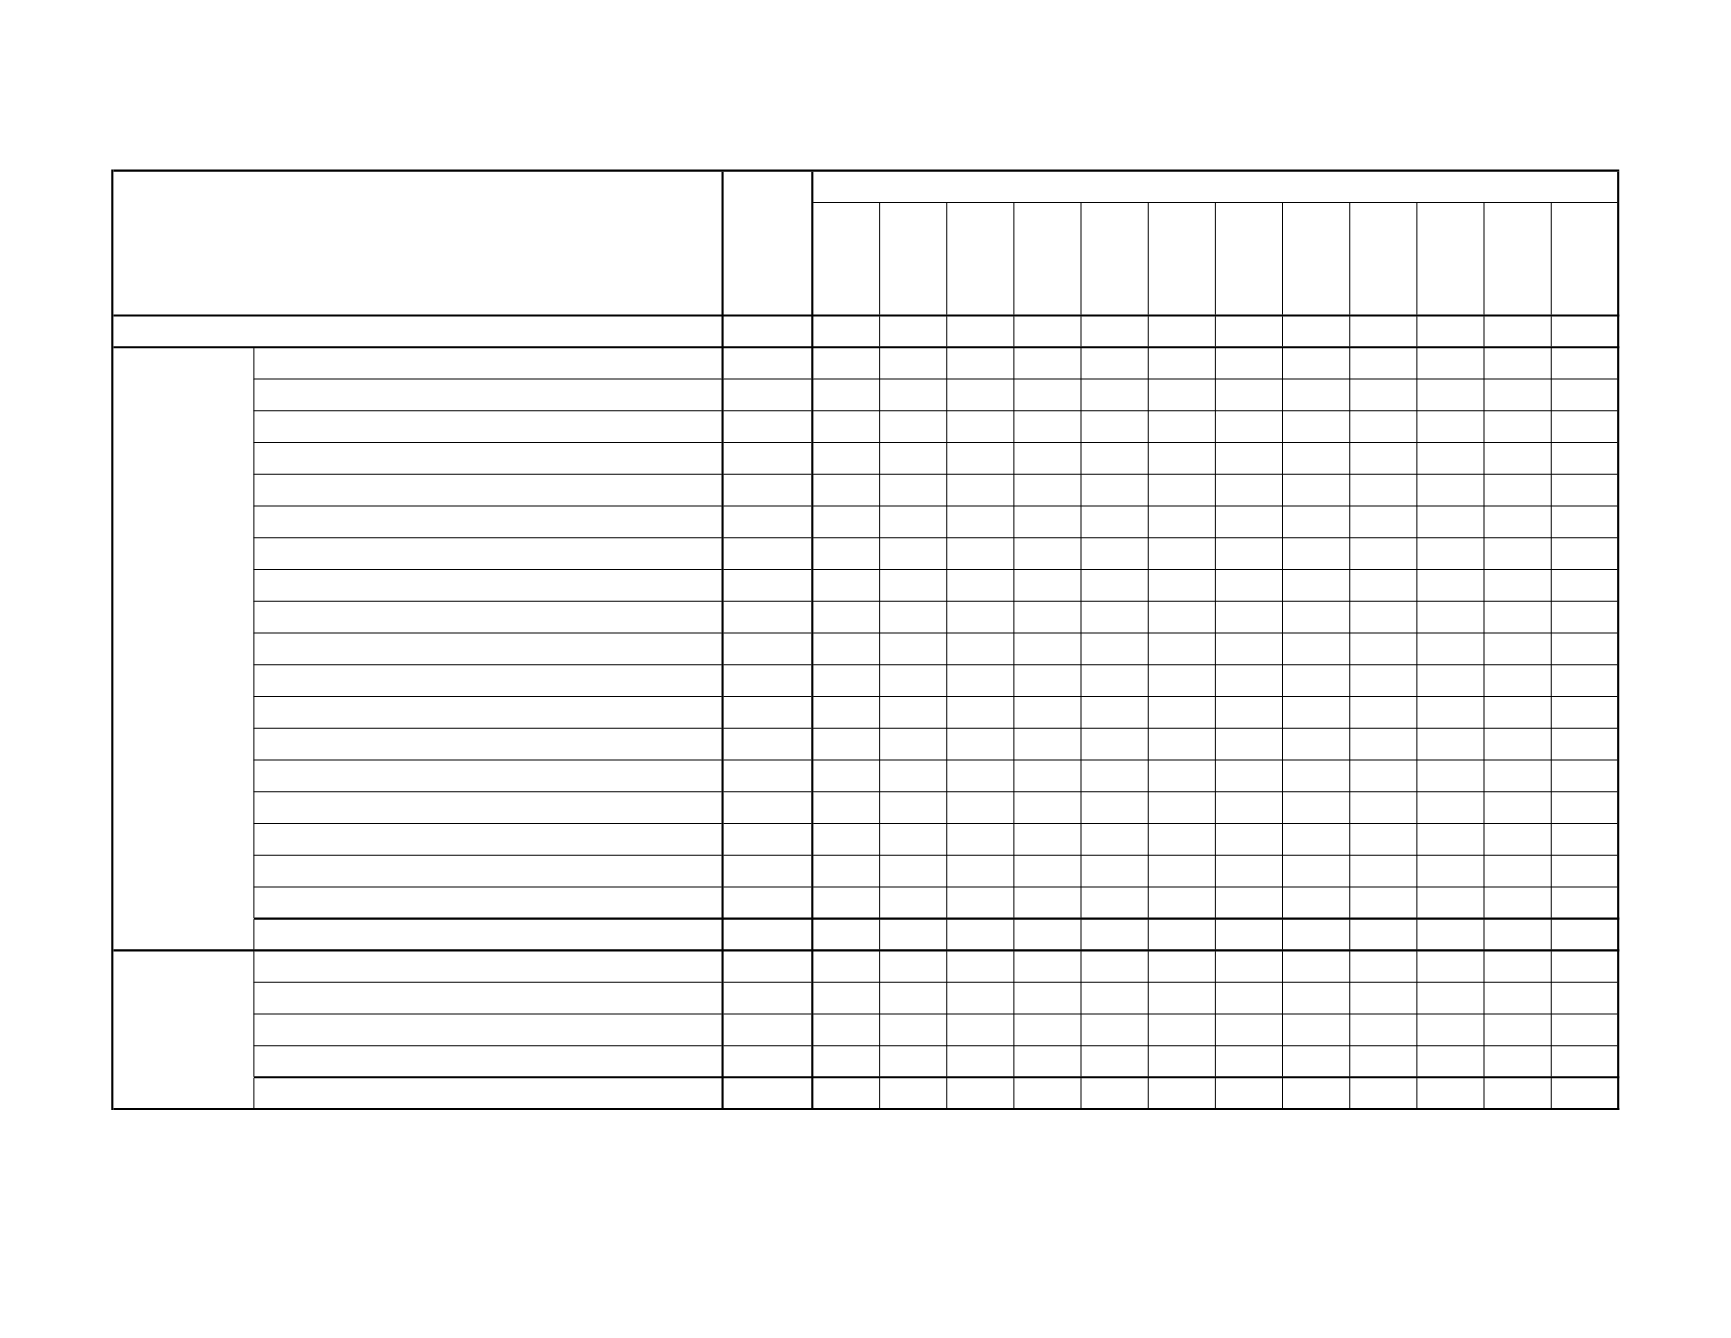
Age group
5.1
AGE-SPECIFIC MORTALITY AMONG AMERICAN INDIANS IN 2013
TOTAL
Notes: * Cell suppressed due to non-zero count less than 6; † Sum rounded to nearest tens unit due to non-zero addend less than 6.
ALL AMERICAN INDIAN RESIDENTS OF ARIZONA
Resided on
reservation
Resided off
reservation
52
Health Status Profile of American Indians in Arizona, 2013 Data Book