(continued)
T M F
T M F
T M F
T M F
T M F
T M F
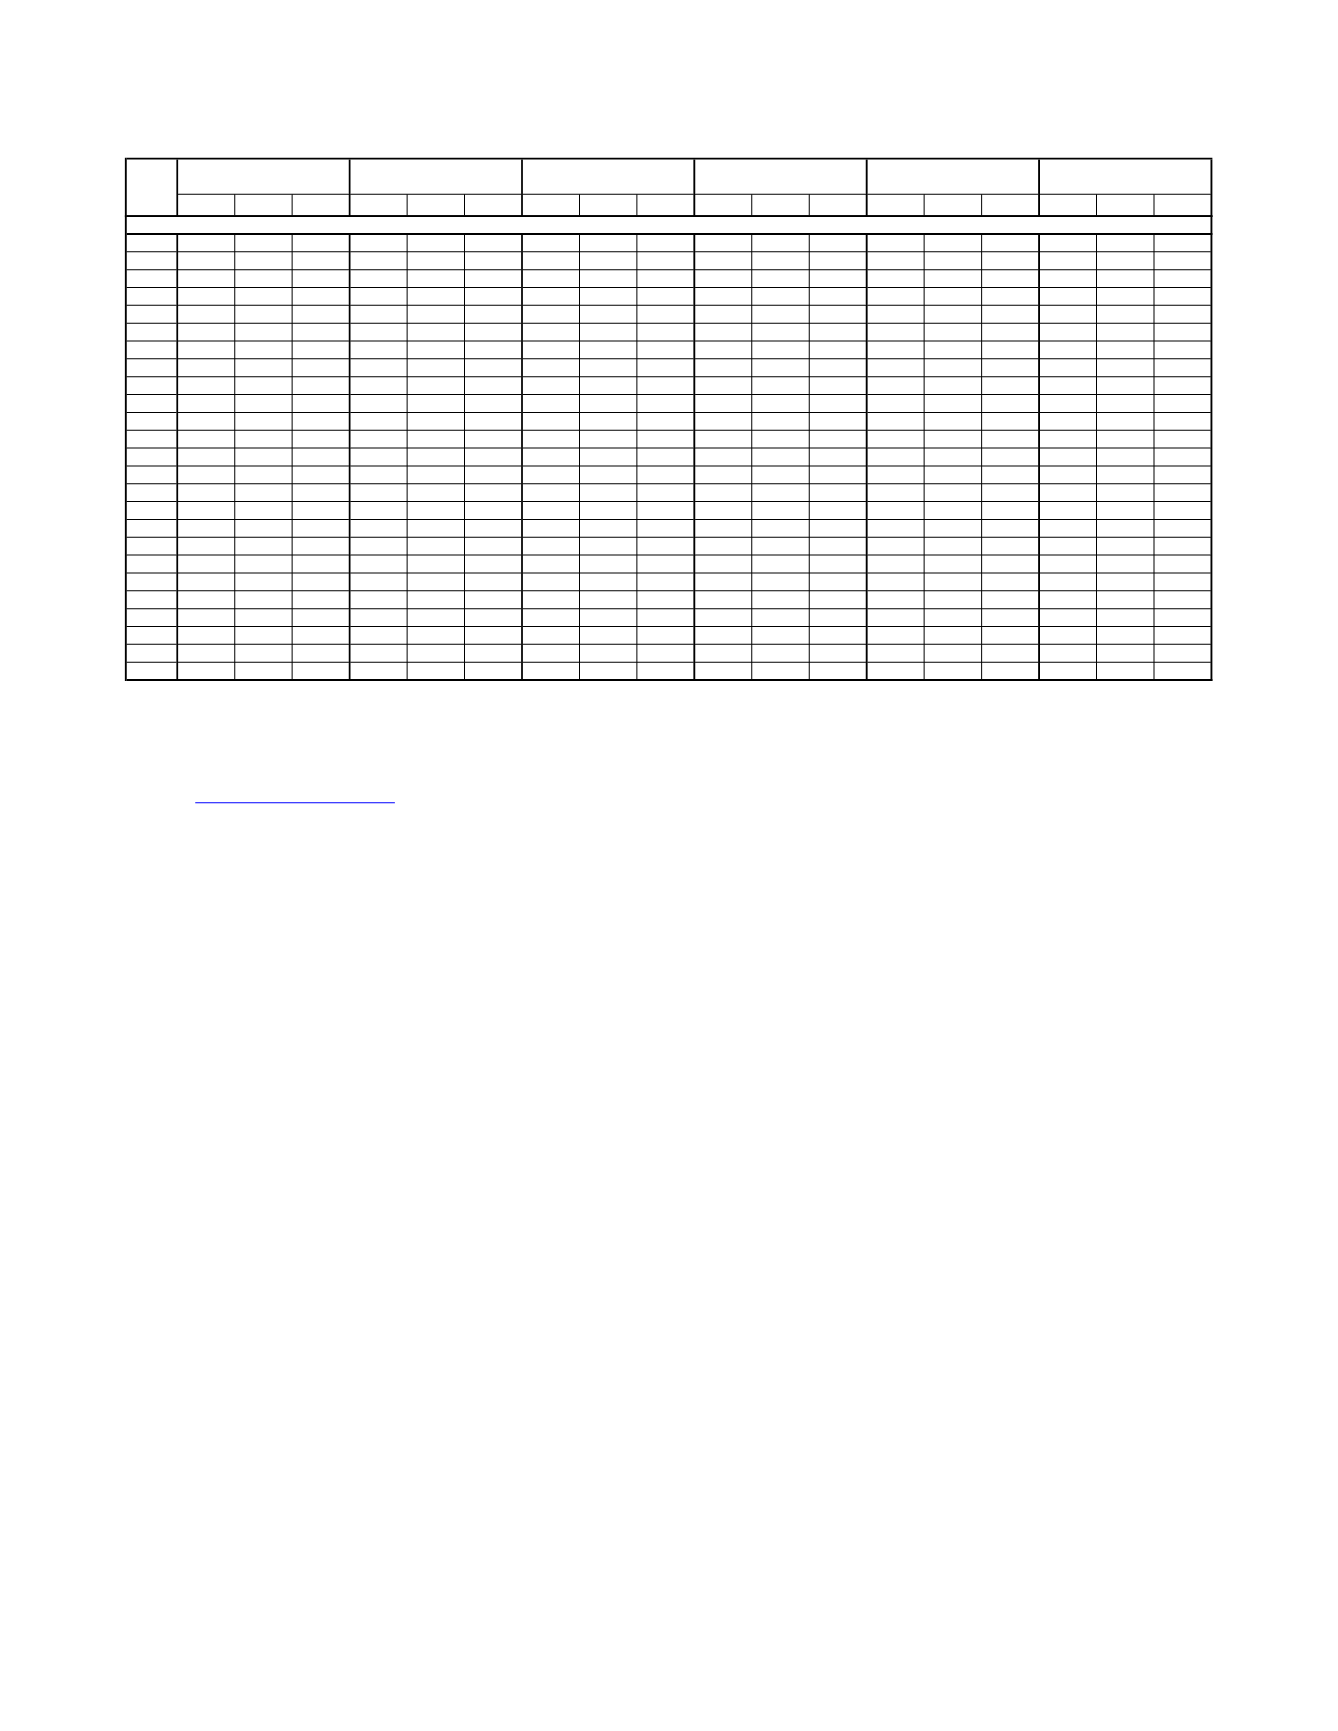
TABLE2B-3
AGE-ADJUSTED
a
MORTALITYRATES FORSELECTEDCAUSESOFDEATHBYRACE/ETHNICITY
ANDGENDER, ARIZONA, 1980, 1990-2013
All groups
Whitenon-Hispanic Hispanic or Latino Black or African
American
American Indianor
AlaskaNative
Asianor Pacific
Islander
1980
17.5 27.9 8.1 18.5 28.7 9.3 11.3 21.1 2.0 10.9 16.8 4.5 18.6 33.1 5.6 8.7 19.6 0.0
1990
19.0 32.6 6.5 20.9 36.1 7.2 9.4 16.6 2.8 12.5 17.2 7.7 20.1 39.1 2.6 7.9 4.6 10.1
1991
18.0 30.8 6.4 19.1 32.8 6.7 12.1 20.3 4.6 17.8 23.6 12.3 18.9 35.1 4.0 2.5 5.5 0.0
1992
17.3 29.0 6.5 18.8 31.1 7.5 10.4 19.2 2.6 10.3 17.8 2.4 19.6 34.7 5.6 4.8 10.5 0.0
1993
18.9 32.2 6.9 21.2 35.7 8.2 8.8 14.9 2.4 8.0 12.4 3.0 21.7 39.1 5.5 5.2 7.7 3.2
1994
19.4 32.2 7.4 21.2 34.9 8.3 11.1 19.6 2.2 8.7 13.9 2.9 20.8 33.0 8.8 16.7 18.9 15.4
1995
19.5 31.1 8.6 22.2 35.1 10.2 9.7 15.8 3.4 14.4 24.6 5.8 16.3 30.0 3.5 4.1 5.0 4.0
1996
16.9 28.4 6.2 19.1 31.8 7.5 9.0 16.2 1.8 7.3 11.7 2.2 15.9 25.6 6.8 4.7 9.9 0.0
1997
17.2 28.7 6.3 19.4 31.8 7.7 8.8 16.3 1.3 12.3 21.5 3.5 18.7 30.5 7.4 11.0 18.2 5.7
1998
17.5 28.7 7.1 20.1 32.2 8.9 9.5 18.4 0.8 6.5 8.7 3.9 16.1 28.1 5.0 6.8 9.1 3.9
1999
15.7 25.5 6.5 16.7 27.1 7.0 10.5 17.8 3.7 12.8 26.1 0.0 16.6 27.6 6.4 6.4 10.3 3.4
2000
14.6 24.7 5.2 16.7 27.6 6.8 7.2 12.7 1.4 6.5 12.2 0.0 16.2 29.7 3.7 5.7 12.3 0.0
2001
14.9 24.6 5.6 12.8 21.0 5.1 5.9 9.9 1.6 9.2 15.2 2.4 15.4 26.4 5.2 9.4 15.4 4.7
2002
15.9 26.4 6.0 18.3 30.0 7.4 8.3 14.2 2.5 6.2 11.4 0.0 17.9 31.7 4.9 4.1 9.1 0.0
2003
14.6 24.0 5.8 16.4 27.1 6.4 8.2 11.8 4.2 11.3 16.6 4.8 15.2 27.4 3.6 6.0 7.0 5.9
2004
14.9 24.1 6.3 16.6 26.4 7.5 9.8 17.5 2.2 12.1 17.3 5.1 17.0 28.5 6.5 4.0 7.0 2.7
2005
15.4 24.9 6.5 16.6 26.7 7.3 10.5 17.8 3.0 3.3 4.7 1.8 17.5 28.7 6.8 11.7 8.9 14.1
2006
15.4 24.7 6.6 17.8 27.9 8.5 8.2 14.2 2.0 8.3 13.9 2.3 13.7 23.4 4.5 8.4 13.2 4.3
2007
15.4 24.4 6.7 18.7 29.4 8.3 9.2 14.7 3.6 6.2 10.1 1.7 9.8 16.3 3.6 6.1 49.2 2.4
2008
14.8 23.0 7.0 17.6 27.3 8.5 6.5 10.8 1.9 7.5 10.3 4.2 13.5 21.2 5.9 9.9 10.7 8.8
2009
16.1 24.6 8.1 18.4 28.0 9.5 9.0 14.0 3.9 10.5 12.7 7.7 15.9 22.9 9.3 9.9 19.9 2.3
2010
16.7 27.1 6.7 20.6 32.8 8.7 7.4 12.5 2.6 6.4 9.9 2.2 18.7 32.3 5.7 6.8 11.0 3.2
2011
17.2 27.4 7.5 22.0 33.1 10.1 8.1 14.8 1.8 9.1 13.7 4.3 14.9 24.0 5.8 5.3 6.9 3.5
2012
16.2 25.9 7.0 20.2 32.2 8.7 6.8 11.1 2.9 10.0 15.5 4.0 17.9 27.9 8.1 5.7 10.2 1.8
2013
17.0 26.6 7.7 20.8 32.4 9.6 8.4 12.8 4.2 6.7 9.7 3.1 21.9 36.1 8.1 7.0 14.5 1.1
Intentional self-harm (suicide)
Notes:
a
Adjusted to the 2000 standard U.S. population;
b
Chronic obstructive pulmonary diseases in 1980 and 1990; beginning in 2000, when the
new standard for the age-adjustment of mortality rates was implemented, all previously published rates for 1979-1999 became obsolete. With the
2008 edition of this report we have added the recomputed age-adjustedmortality rates for 1991-1999. In order to compute these rates, we have
used the population denominators consistent with both the 1990 and 2000 census. Themortality rates for 1989-1999 in Table 2B-2 alsowere revised
for consistency; The denominators are available at:
Arizona Health Status and Vital Statistics 2013
131


