2B. LEADING CAUSESOF DEATH
Chronic liver disease and cirrhosis
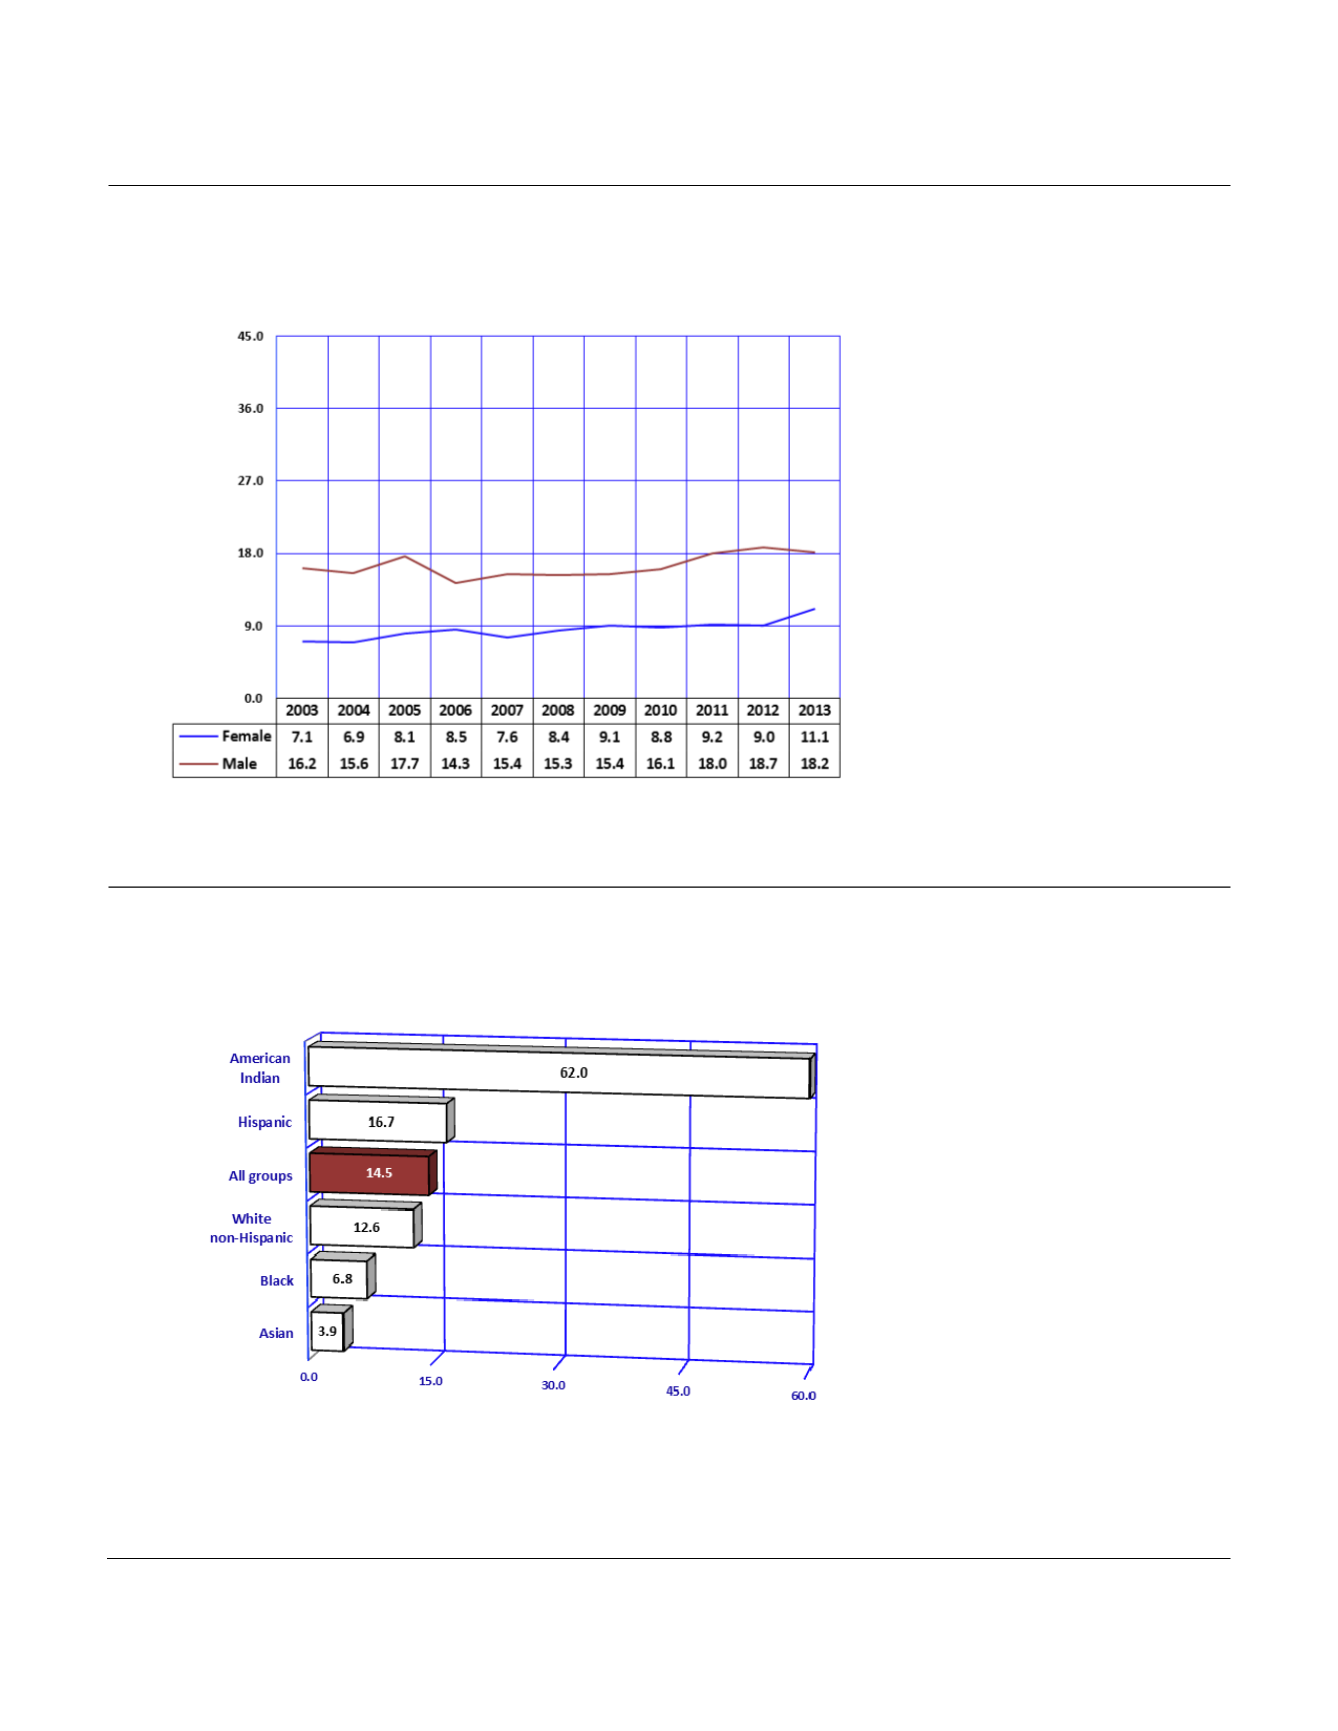
Figure2B-24
Age-adjustedMortalityRates
a
for Chronic Liver Disease andCirrhosis
byGender andYear, Arizona, 2003-2013
Notes:
a
Number of deaths per 100,000 population age-adjusted to the 2000 U.S. standard.
Chronic liver disease and
cirrhosis was the 9
th
leading
cause of death in Arizona in
2013 (
Figure 2B-1, Table 2B-
1
). Among the 1,040 deaths
due to chronic liver disease and
cirrhosis, 636 (61.2 percent)
weremales (
Table 2B-4
).
Among females, the age-
adjusted mortality rate for
chronic liver disease and
cirrhosis slightly increased 23.3
percent from 2012 to 2013.
Among males, the mortality
rate decreased 2.7 percent
from 18.7/100,000 in 2012 to
18.2/100,000 in 2013 (
Figure
2B-24
,
Table 2B-3
).
In 2013, Navajo, Apache, Gila,
La Paz, Mohave, and Graham
counties had the highest
mortality rates for chronic liver
disease and cirrhosis (
Table
5E-11
).
Figure2B-25
Age-adjustedMortalityRates
a
for Chronic Liver Disease andCirrhosis
byRace/Ethnicity, Arizona, 2013
Notes:
a
Number of deaths per 100,000 population age-adjusted to the 2000 U.S. standard.
The 2013 death rate for chronic
liver disease and cirrhosis
among American Indians (62.0
deaths per 100,000) was 4.3
times greater than the state
average
(14.5/100,000;
Figure 2B-25, Table 2B-4
).
The rate for Hispanics (16.7
deaths per 100,000 population)
was the second highest among
racial/ethnic groups in the
State.
Compared to themedian age at
death from all causes (76
years), those who died from
chronic liver disease and
cirrhosis were on average 18
years younger (58 years,
Table 2D-3
). In 2013, the
median age at death of
American Indians who died
from chronic liver disease and
cirrhosis was only 49 years
(
Table2D-3
).
122
Arizona Health Status and Vital Statistics 2013


