2B. LEADING CAUSESOF DEATH
Diabetes
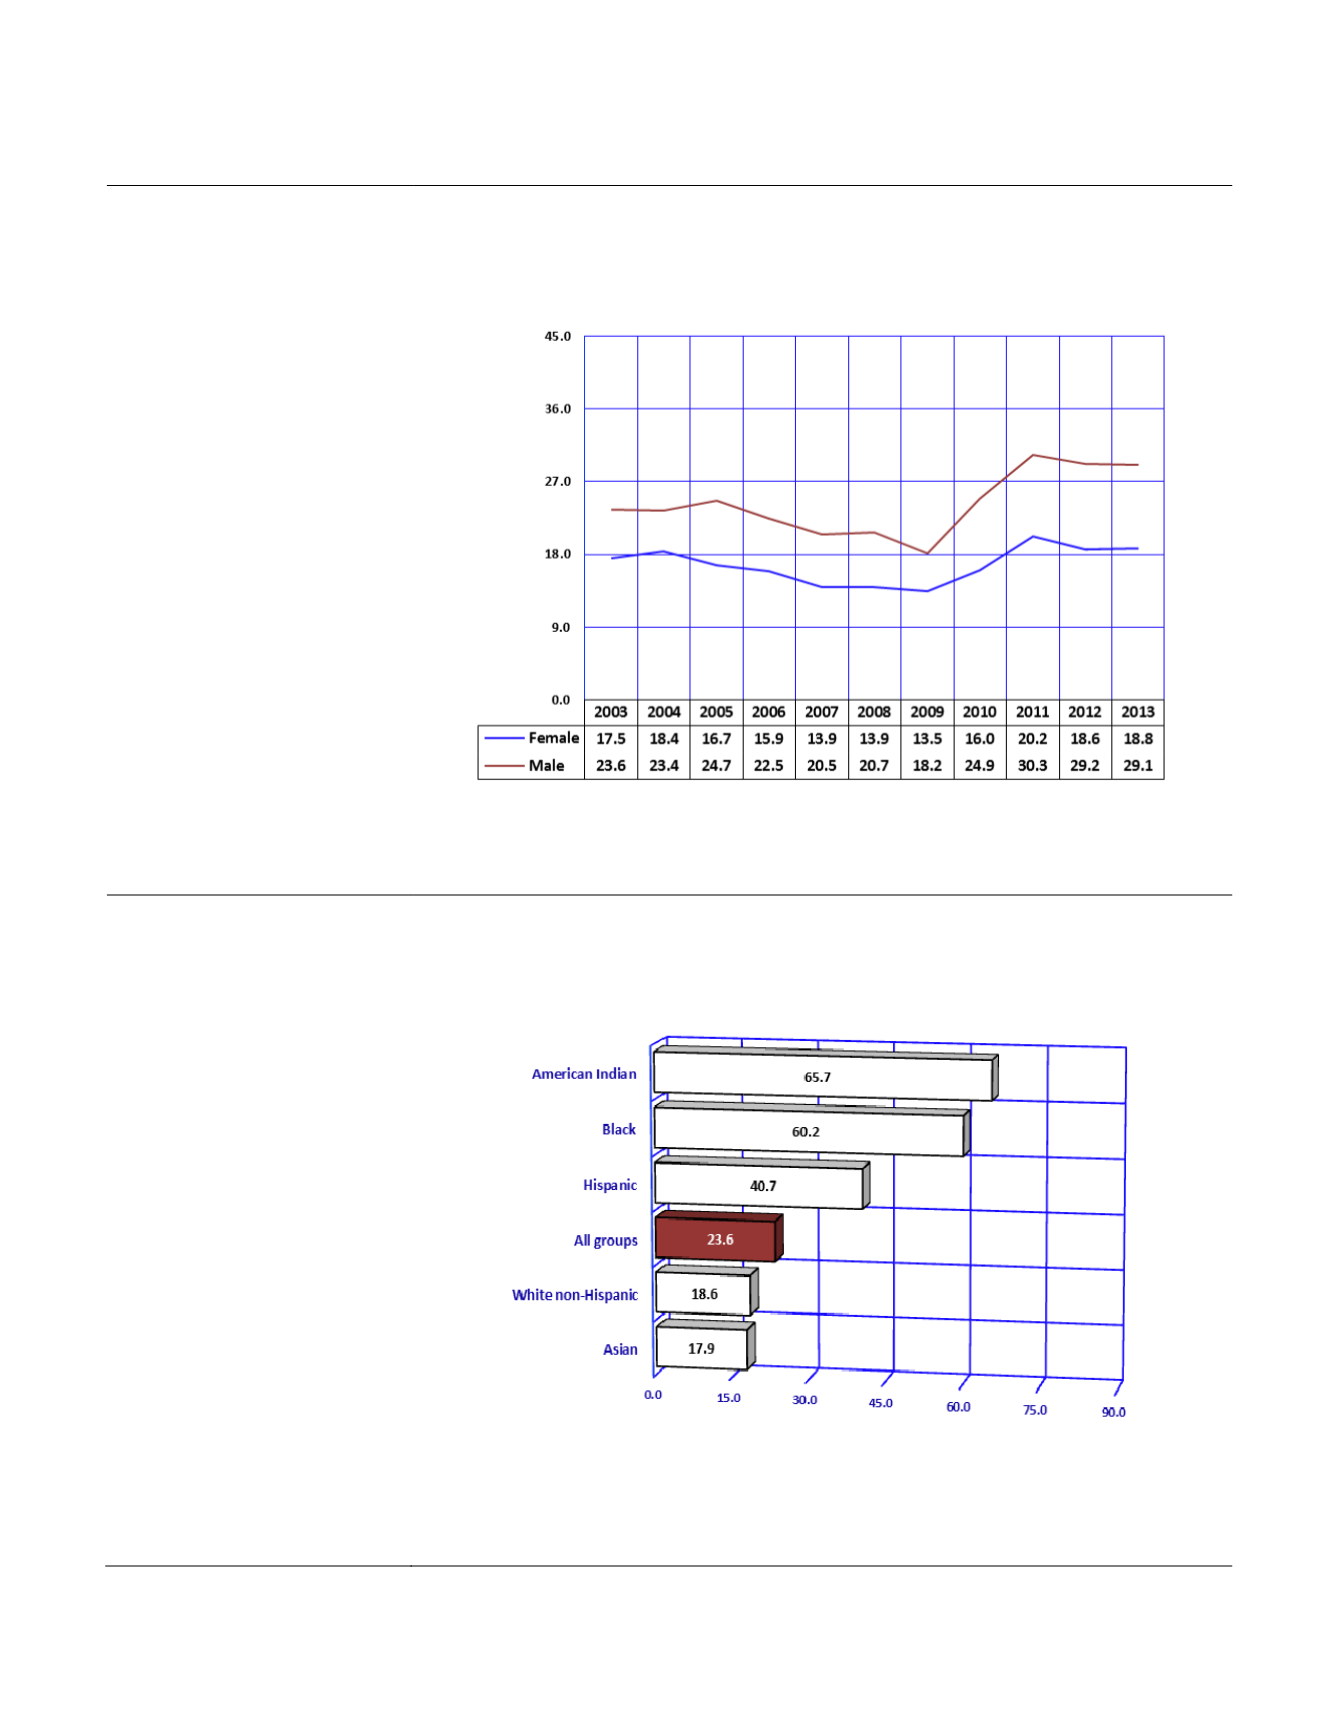
Both men and women
experienced a decline in
mortality rates for diabetes
from 2005 to 2009 (
Figure
2B-18
), but from 2009 to
2013, the number of deaths
from diabetes increased by
61.8 percent (based on the
data in
Table 2B-1
).
In addition to 1,744 deaths
that had diabetes assigned as
the underlying cause in 2013,
another 2,762 deaths had
diabetes assigned as a
contributing
factor.
The
diabetes-related death rate of
60.7/100,000 (
Table 6A-6
)
was 2.6 times greater than the
rate for diabetes as underlying
cause (23.6/100,000,
Table
2B-2
).
The diabetes-related death rate
includes all mentions of
diabetes on the death
certificate as the underlying or
other than underlying cause.
Figure2B-18
Age-adjustedMortalityRates
a
for Diabetes byGender andYear,
Arizona, 2003-2013
Notes:
a
Number of deaths per 100,000 population age-adjusted to the 2000 U.S. standard.
In 2013, compared to Arizona?s
rate, American Indians were
2.8 times more likely to die
from diabetes (65.7 deaths per
100,000;
Figure 2B-19
,
Table
2B-4
). The rate of 17.9 deaths
per 100,000 among Asians was
the lowest rate among all
racial/ethnic groups in the
State.
Among the 15 Arizona
counties, in 2013 Apache
(44.3/100,000),
Graham
(44.2/100,000), and Yuma
(44.1/100,000) counties had
the highest mortality rates for
diabetes (
Table5E-11
).
Figure2B-19
Age-adjustedMortalityRates
a
for Diabetes byRace/Ethnicity,
Arizona, 2013
Notes:
a
Number of deaths per 100,000 population age-adjusted to the 2000 U.S. standard.
Arizona Health Status and Vital Statistics 2013
119


