2B. LEADING CAUSESOF DEATH
Influenza andpneumonia
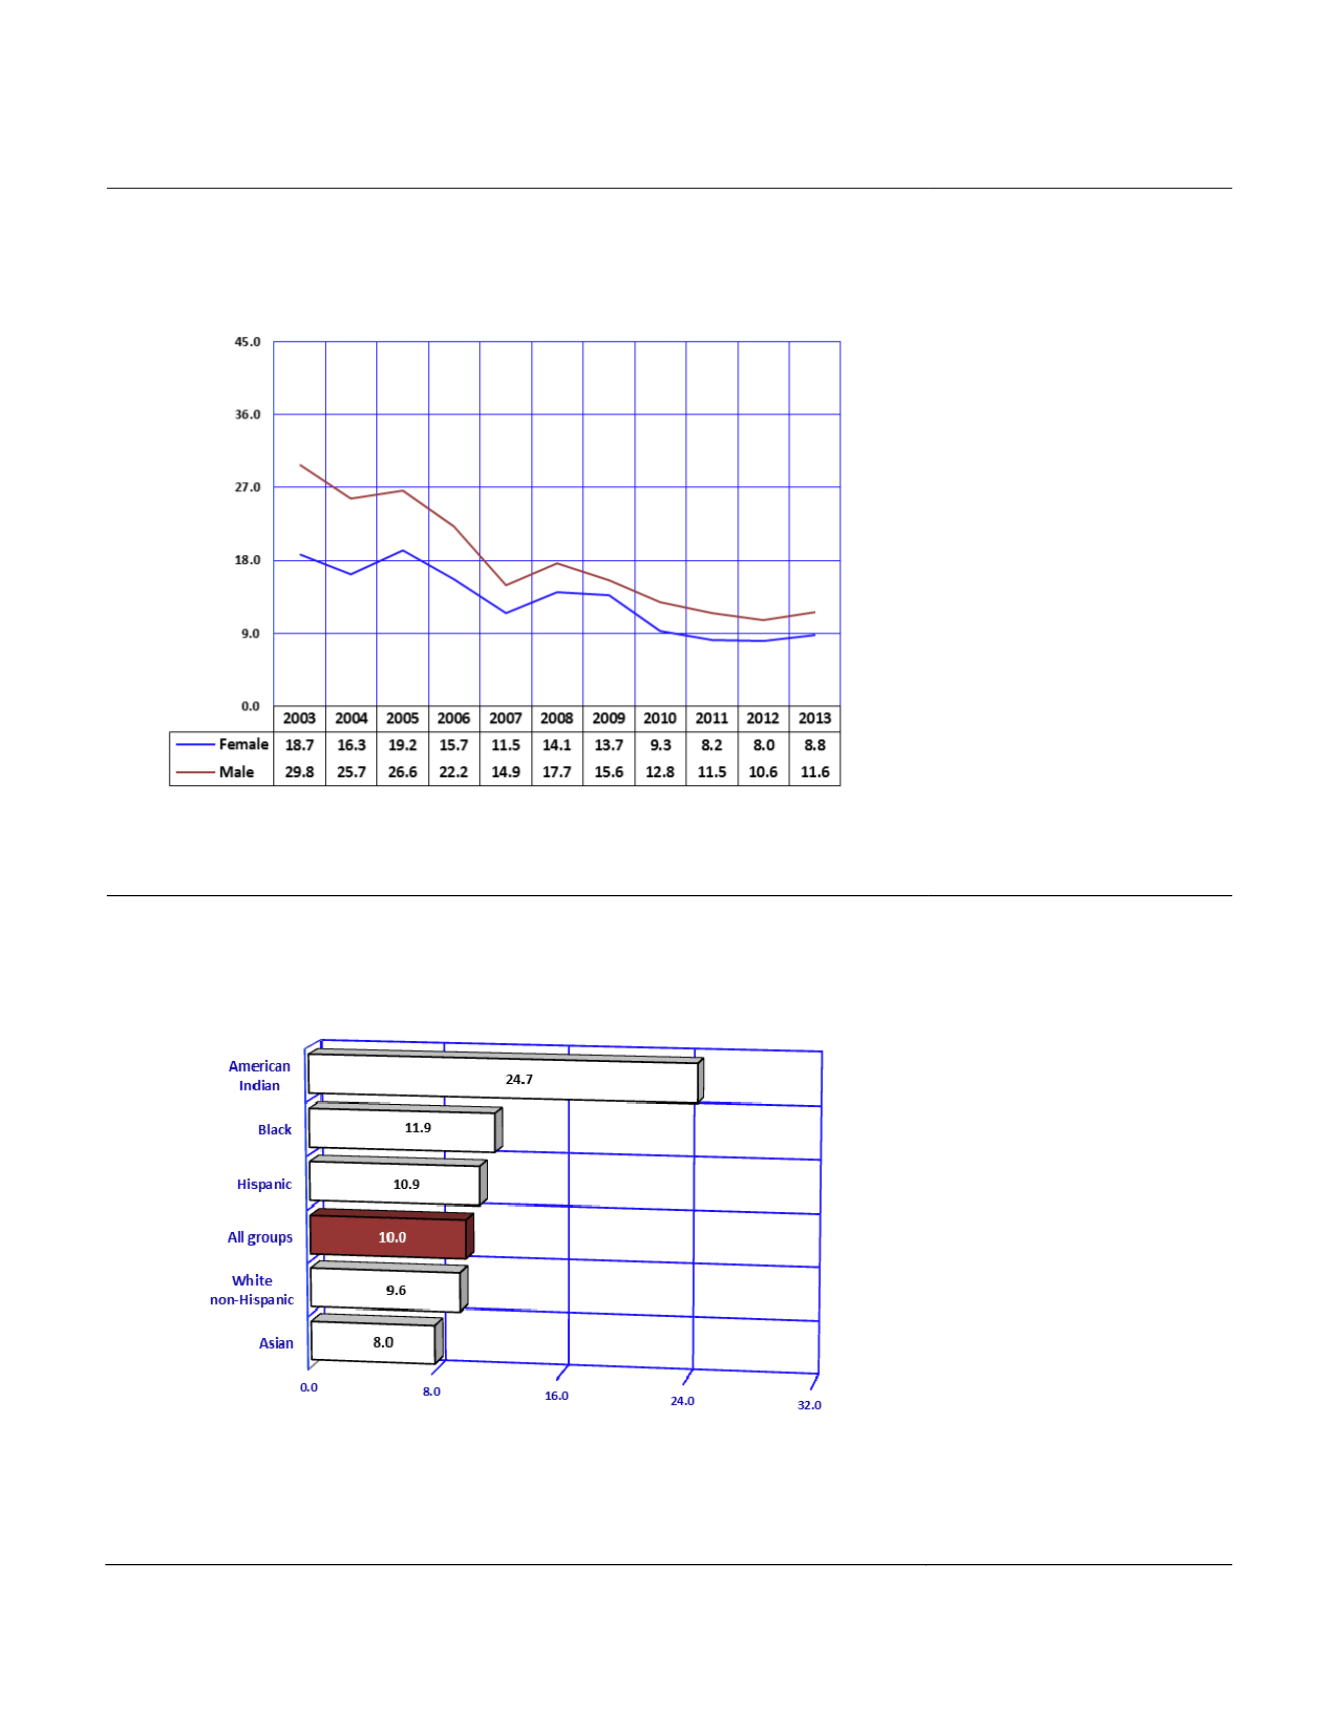
Figure2B-20
Age-adjustedMortalityRates
a
for InfluenzaandPneumoniaby
Gender andYear, Arizona, 2003-2013
Notes:
a
Number of deaths per 100,000 population age-adjusted to the 2000 U.S. standard.
The number of deaths from
influenza and pneumonia
decreased by 43.4 percent
from a recent high of 1,280 in
2005 to 724 in 2013, though
the number of influenza deaths
rose 14.0 percent from 2012 to
2013 (
Table 2B-1
). Among the
724 deaths, influenza was
identified as the underlying
cause for 42 of them, while
pneumonia was listed as the
underlying cause on 682 death
certificates (
Table2B-6
).
The mortality rate for influenza
and pneumonia increased for
females from 8.0 deaths per
100,000 in 2012 to 8.8 deaths
in 2013 (
Figure 2B-20, Table
2B-2
). The mortality rate for
influenza and pneumonia also
increased for males from 10.6
deaths per 100,000 in 2012 to
11.6/100,000 in 2013.
In 2013, the age-adjusted
mortality rate for Arizonamales
was 31.8 percent greater than
that of Arizona females.
Figure2B-21
Age-adjustedMortalityRates
a
for InfluenzaandPneumoniaby
Race/Ethnicity, Arizona, 2013
Notes:
a
Number of deaths per 100,000 population age-adjusted to the 2000 U.S. standard.
In 2013, American Indian
residents of Arizona had the
highest mortality rate for
influenza and pneumonia (24.7
deaths per 100,000) among
the racial/ethnic groups. The
age-adjusted mortality of
8.0/100,000 among Asians was
the lowest rate among
racial/ethnic groups in the
State (
Figure 2B-21
,
Table
2B-4
).
Compared to the State death
rate
for
influenza
and
pneumonia, Apache County?s
rate was 2.6 times greater
(26.4/100,000). The mortality
rate was also elevated in
Navajo County (20.1/100,000),
Gila County (18.3/100,000),
and
Yuma
County
(17.8/100,000;
Table5E-11
).
120
Arizona Health Status and Vital Statistics 2013


