2B. LEADING CAUSESOF DEATH
Accidents (unintentional injury)
The number of deaths from unintentional
injuries increased by 13.2 percent from
2,804 in 2012 to 3,173 in 2013 (
Table
2B-1
). In 2013, based on age-adjusted
mortality rates, accidents ranked third as
a leading cause of death for males and
fifth for females (
Table 2B-4
). From 2012
to 2013, the age-adjusted mortality rate
for accidents increased 11.3 percent for
males and 5.8 percent for females
(
Figure2B-10
).
A number of deaths due to common types
of unintentional injuries increased from
2012 to 2013 (see
Table 2B-9
). Deaths
due to excessive natural cold were more
than two times higher in 2013 than in
2012, and deaths due to fire, flames, or
smoke increased 58 percent (likely
attributable to the Yarnell Hill Fire that
killed 19 firefighters in June of 2013).
Deaths due to poisoning by gases or
vapors increased 30.2 percent over this
period, as did poisonings due to drugs
and/or medicaments (16.7 percent).
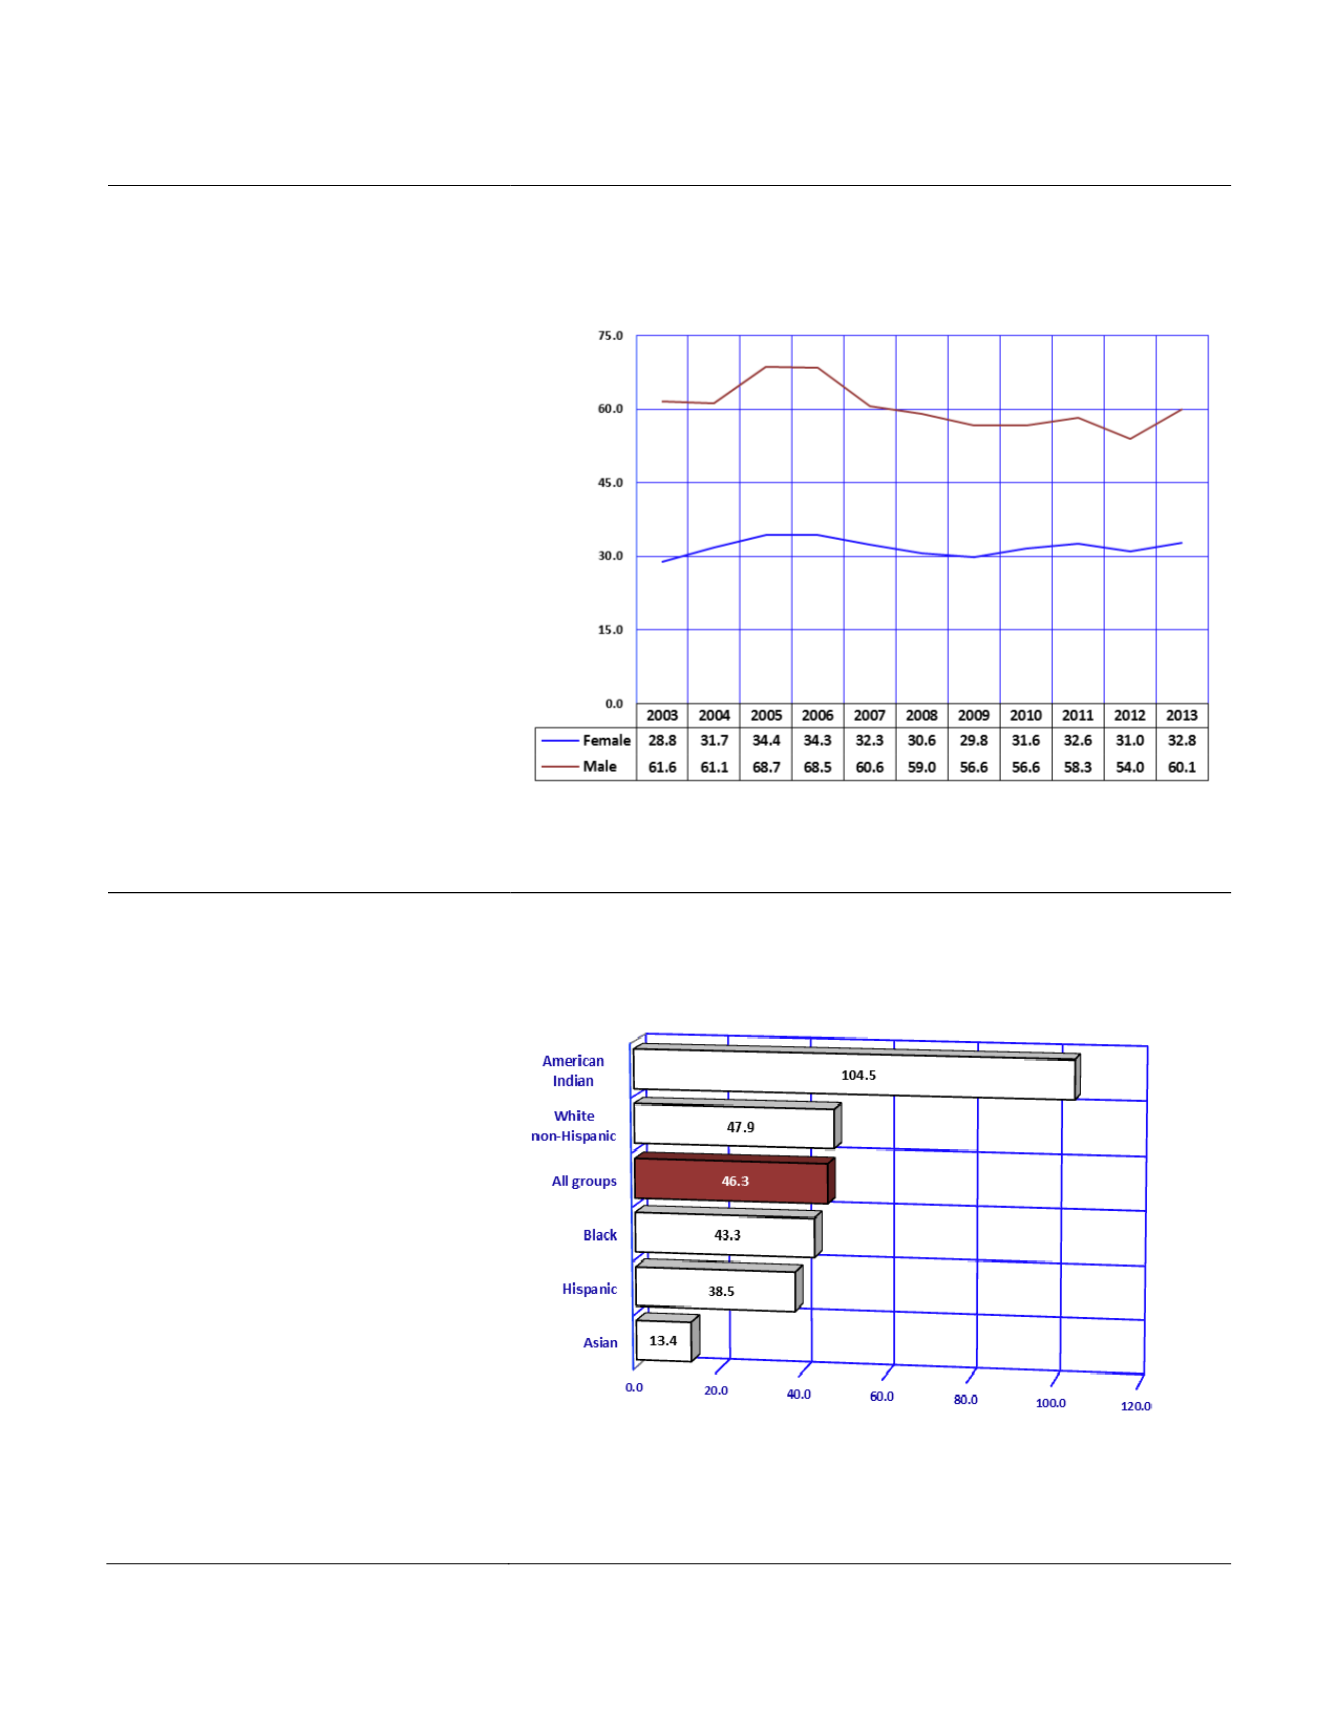
Figure 2B-10
Age-adjustedMortalityRates
a
for Accidents (Unintentional Injuries) by
Gender andYear, Arizona, 2003-2013
Notes:
a
Number of deaths per 100,000 population age-adjusted to the 2000 U.S. standard.
The American Indian death rate for
unintentional injuries (104.5/100,000)
was 7.8 times greater than the rate for
Asians (13.4/100,000), the group at the
lowest risk of unintentional injury death
among racial/ethnic groups in the State
(
Figure2B-11
,
Table2B-4
).
In 2013, Apache (108.7/100,000) and
Navajo (106.1/100,000) counties had the
two highest age-adjusted mortality rates
for unintentional injuries (
Table5E-11
).
Figure 2B-11
Age-adjustedMortalityRates
a
for Accidents (Unintentional Injuries) by
Race/Ethnicity, Arizona, 2013
Notes:
a
Number of deaths per 100,000 population age-adjusted to the 2000 U.S. standard.
Arizona Health Status and Vital Statistics 2013
115


