


 20 / 96

<15
15-17
18-19
20-24
25-29
30-34
35-39
40-44
45+
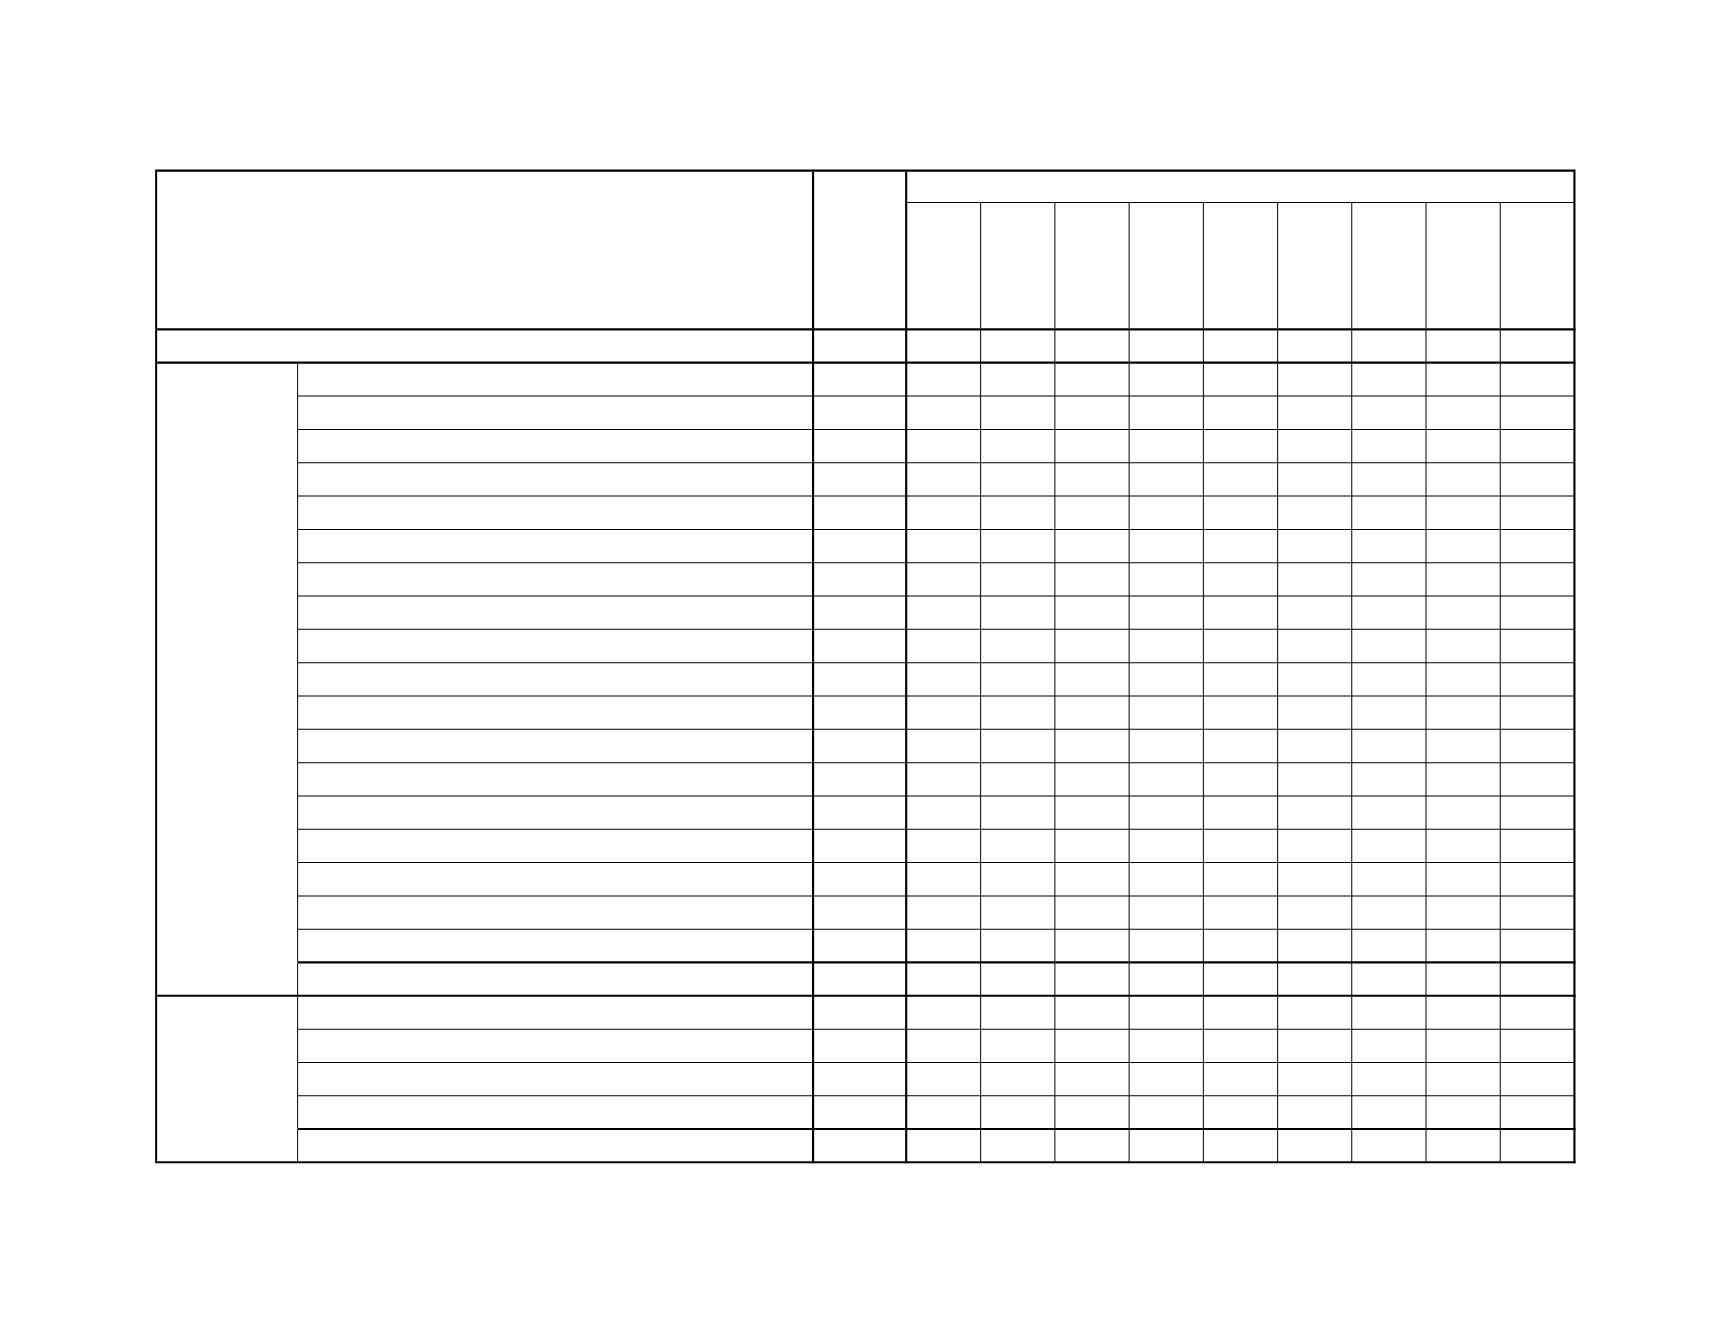
5,480† 10† 240† 520† 1,780† 1,470† 920† 420† 100† 10†
Ak-Chin Indian Community
20†
0
*
*
*
7
*
*
0
0
Cocopah Tribe
20†
0
*
*
7
*
0
*
0
0
Colorado River Indian Tribe
60†
0
*
7 18 14 11
*
*
0
Fort McDowell Yavapai Nation Reservation
20†
0
*
*
6
7
*
0
0
0
Fort Mohave Indian Tribe
10†
0
0
0
*
*
*
*
0
0
Gila River Indian Community
60†
0
*
7 24 17
6
*
0
0
Havasupai Tribe
10†
0
0
*
*
*
*
*
0
0
Hopi Tribe
170†
0
7 17 64 32 29 14
*
*
Hualapai Tribe
30†
0
*
*
*
7
8
*
*
0
Navajo Nation
1,330†
* 62 117 409 358 216 127 37
*
Pascua Yaqui Tribe
70†
0
6 12 20 17
7
*
0
0
Salt River Pima-Maricopa Indian Community
100†
*
8 14 36 20 15
*
*
0
San Carlos Apache Tribe
290†
* 27 37 100 68 39 12
0
*
San Xavier
20†
*
*
*
*
*
*
*
*
0
Tohono O'Odham Nation
140†
0 13 14 49 31 24
9
*
0
White Mountain Apache Tribe
280†
* 14 35 102 74 38 11
*
*
Yavapai-Apache Nation
20†
0
*
* 10
*
*
0
0
0
Yavapai-Prescott Indian Tribe
0†
0
0
0
*
0
*
*
*
0
TOTAL
2,630† 10† 150† 280† 870† 670† 410† 200† 50† 10†
---in Maricopa County
1,560†
0 48 131 501 432 299 117 25
*
---in Pima County
310†
0 10 29 94 94 51 21
7
*
---in Coconino County
220†
0
7 17 58 59 49 22
*
0
---elsewhere in Arizona
760†
0 27 70 260 217 117 63
8
*
TOTAL
2,844
0 92 247 913 802 516 223 50† 10†
4.1
MATERNAL AGE (2013 STATUS)
TOTAL
BIRTHS
Mother's age group
Notes: * Cell suppressed due to non-zero count less than 6; † Sum rounded to nearest tens unit due to non-zero addend less than 6.
ALL AMERICAN INDIAN RESIDENTS OF ARIZONA
Resided on
reservation
Resided off
reservation
20
Health Status Profile of American Indians in Arizona, 2013 Data Book