


 24 / 96

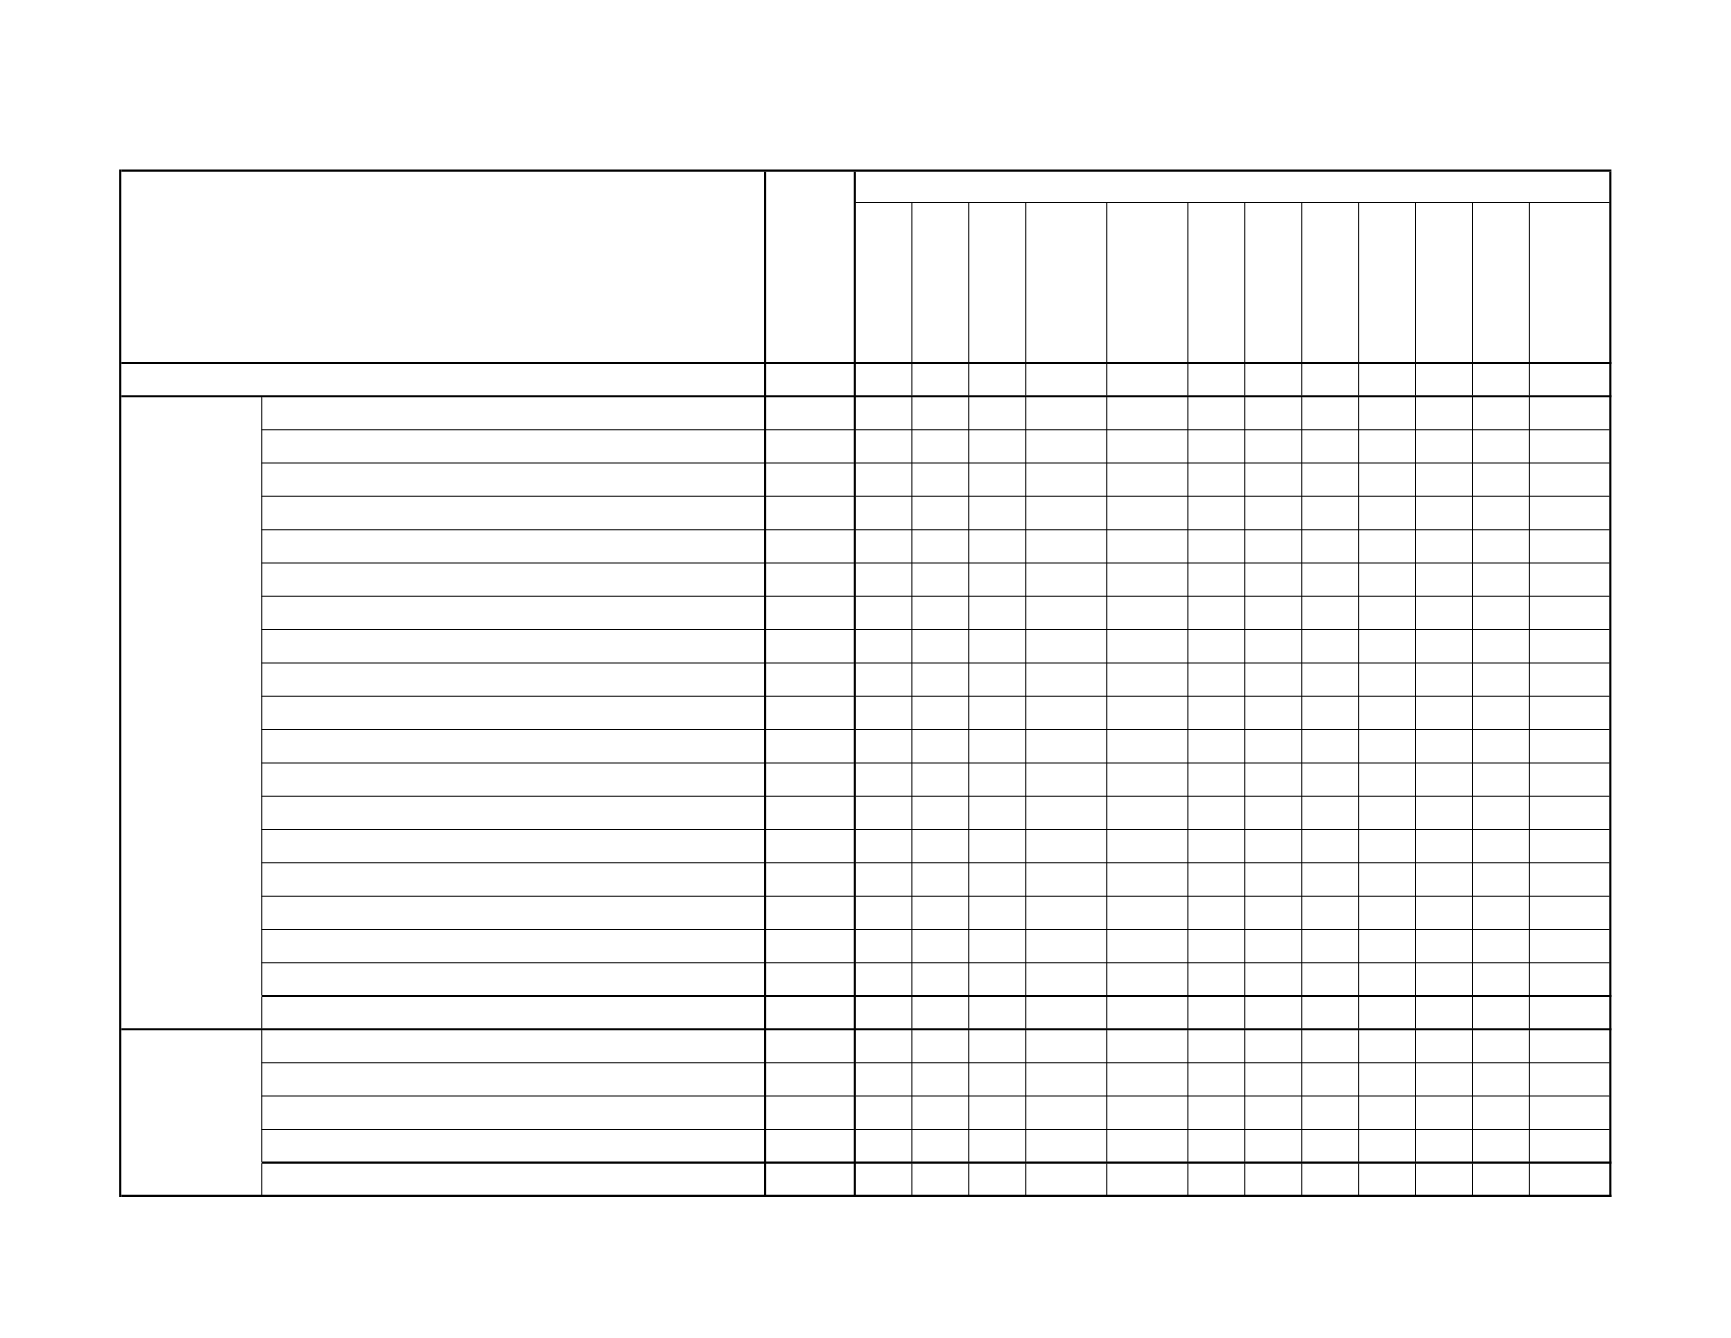
<15
15-17
18-19
20-24
25-29
30-34
35-39
40-44
45-49
50-54
55+
Unknown
5,480† 0 90† 300† 1,210† 1,170† 830† 460† 200† 80† 30† 20† 1,100†
Ak-Chin Indian Community
20† 0 0 *
6
* * 0 * 0 0 0
*
Cocopah Tribe
20† 0 0 *
7
* * * 0 0 0 0
*
Colorado River Indian Tribe
60† 0 0 *
9
12 9 * 0 * 0 *
18
Fort McDowell Yavapai Nation Reservation
20† 0 * *
*
* * 0 * * 0 0
9
Fort Mohave Indian Tribe
10† 0 0 0
*
* * 0 * 0 0 0
0
Gila River Indian Community
60† 0 * *
19
9 6 * 0 0 0 0
21
Havasupai Tribe
10† 0 0 0
*
* * * 0 0 0 0
*
Hopi Tribe
170† 0 * 6
40
36 20 13 12 6 0 *
30
Hualapai Tribe
30† 0 * *
*
7 * * 0 * 0 0
6
Navajo Nation
1,330† 0 21 74 294 285 207 137 58 22 12 * 217
Pascua Yaqui Tribe
70† 0 0 6
20
7 11 * 0 0 * 0
15
Salt River Pima-Maricopa Indian Community
100† 0 8 6
21
16 12 6 * * * 0
28
San Carlos Apache Tribe
290† 0 8 22
68
57 34 9 6 * * *
78
San Xavier
20† 0 0 *
*
* * * * 0 0 0
7
Tohono O'Odham Nation
140† 0 7 8
26
23 10 16 6 * * 0
44
White Mountain Apache Tribe
280† 0 9 21
84
55 34 17 8 * * 0
48
Yavapai-Apache Nation
20† 0 0 *
*
* * 0 0 0 0 0
*
Yavapai-Prescott Indian Tribe
0† 0 0 0
0
* 0 * 0 0 * 0
*
TOTAL
2,630† 0 60† 160† 610† 530† 360† 220† 100† 40† 20† 10† 540†
---in Maricopa County
1,560† 0 15 70 327 368 259 136 50 19 8 * 303
---in Pima County
310† 0 * 15
59
69 49 20 10 * * *
71
---in Coconino County
220† 0 * 8
35
50 52 29 14 * 0 0
26
---elsewhere in Arizona
760† 0 6 44 174 155 113 58 29 19 * * 159
TOTAL
2,844 0 30† 137 595 642 473 243 103 40† 10† 10† 559
Notes: * Cell suppressed due to non-zero count less than 6; † Sum rounded to nearest tens unit due to non-zero addend less than 6.
ALL AMERICAN INDIAN RESIDENTS OF ARIZONA
Resided on
reservation
Resided off
reservation
Father's age group
4.5
AGE OF FATHER (2013 STATUS)
TOTAL
BIRTHS
24
Health Status Profile of American Indians in Arizona, 2013 Data Book