Page |7
The observed racial/ethnic status ofArizona?s older adults in 2010 stands in contrast to the
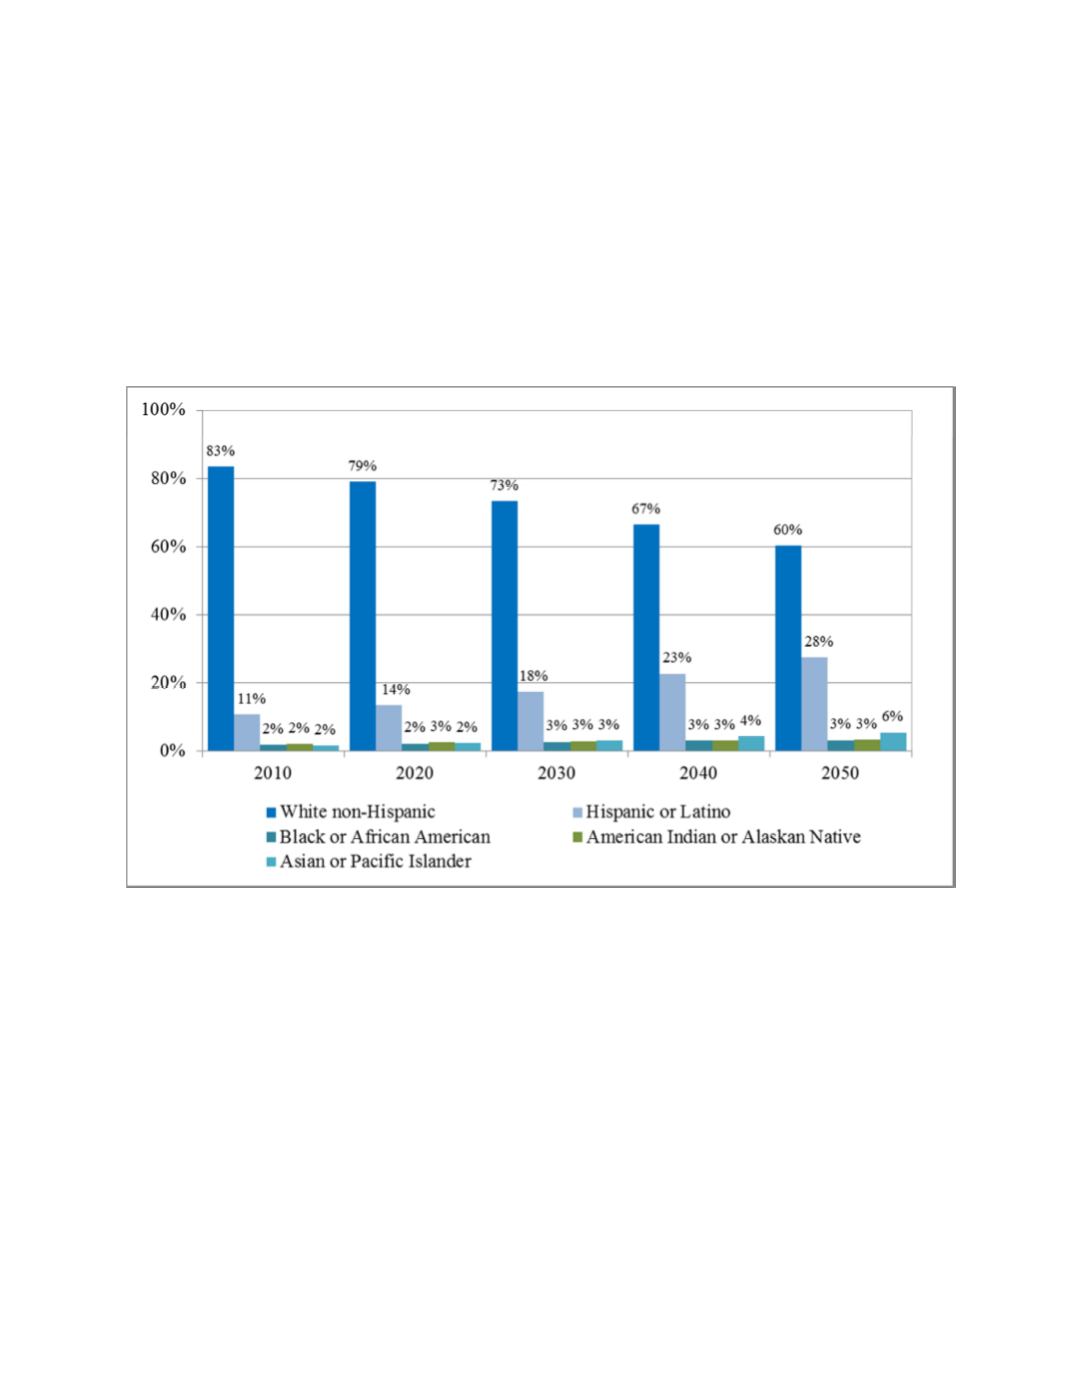
projected racial/ethnic composition ofArizona?s older adults in 2050. As displayed inTable 1
andFigure 1, the proportion of olderArizonanswho areWhite non-Hispanic is expected to
decrease 23 percent from 2010 to 2050, with the proportion of the population beingHispanic or
Latino increasingby17 percent. The percentage ofArizona?s older adult populationwho are
Asian or Pacific Islander, Black orAfricanAmerican, andAmerican Indian or Pacific Islander
also is expected to increase, but at amuch lower rate than that ofHispanics.
Figure 1. Projections ofArizona?s Population ofAdultsAge 65 andOlder byRace/Ethnicity,
2010 ? 2050
Finally, Figures 2 and 3 provide representation ofArizona?s population age distribution by
gender and age-group for 2010 and 2050. Included in the figures are the dependency ratios for
2010 and 2050, expressing the ratio of dependent individuals (the young and oldwho typically
do not work) toworkingmembers of society (those aged 15 ? 64who typicallydowork).
In 2010, the population pyramid can be described as roughly stationary,meaningbirth rates have
remained stable over recent years (indicated by the fairly even distribution of population by age
group and gender from age 5 and under to age 50 ? 54) and that death rates amongolder adults
were relatively low. The dependency ratio in 2010was fairlybalanced at 53.9,meaning for every
100working individuals therewere about 54 individualswhowere likelynot working.


