Page |8
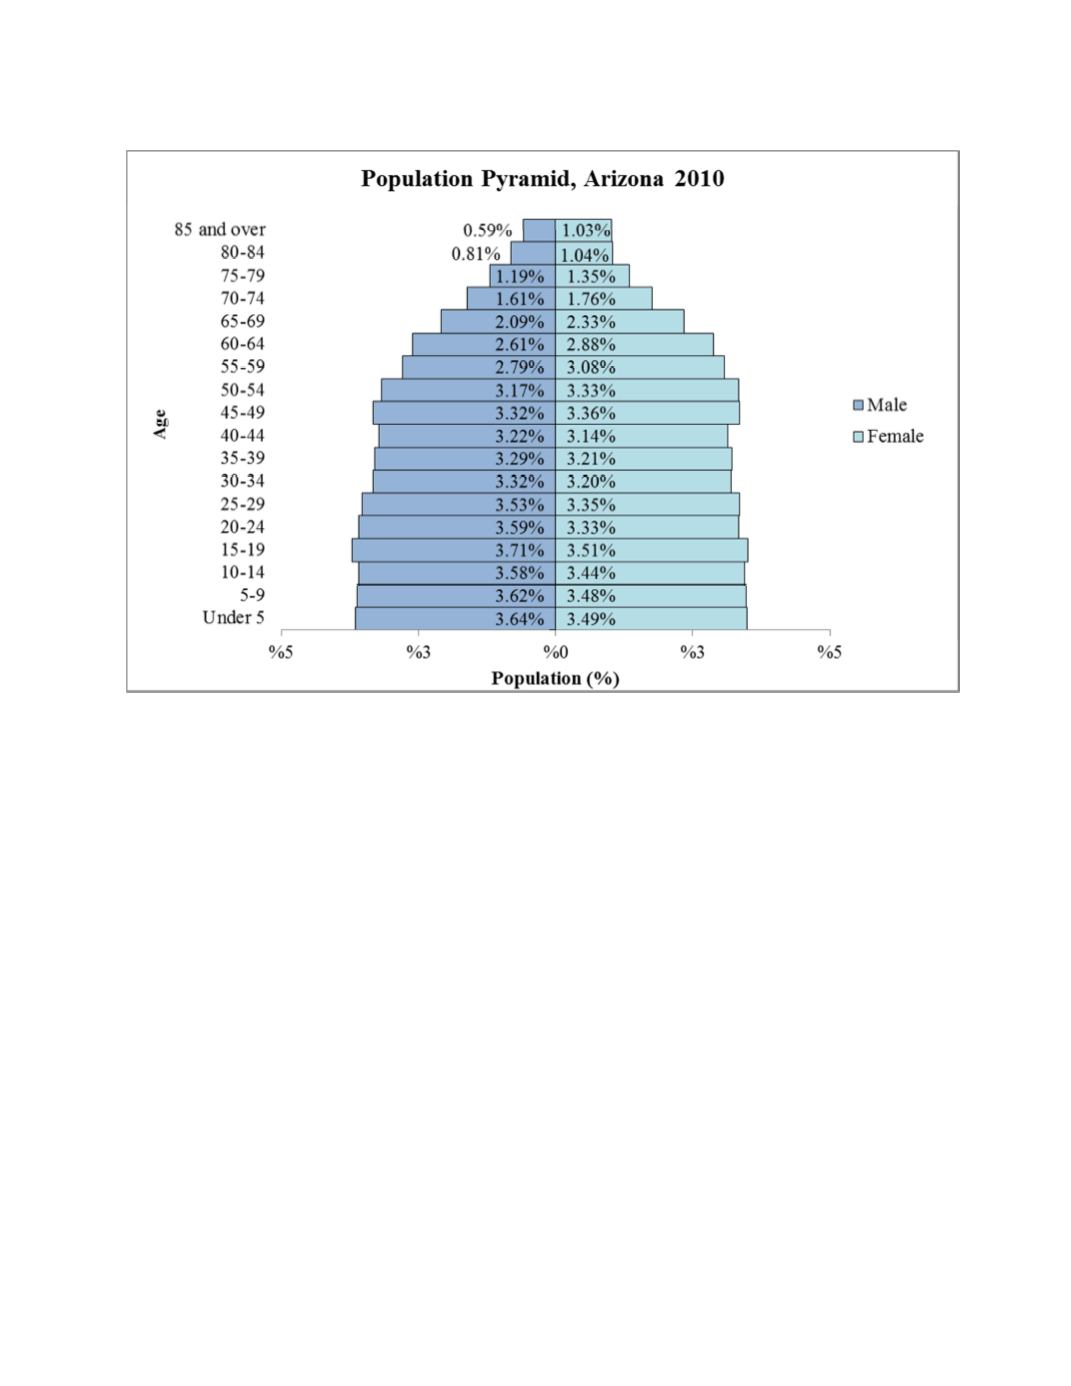
Figure 2. PopulationPyramid andDependencyRatios forArizona, 2010
Notes:
a
Dependency ratio= (Arizona residents 0 ? 14 years +Arizona residents 65+ years)/
Arizona residents 15 ? 64.
In comparison, the population pyramid representingArizona?s projected population age
composition in 2050 can be described as contractive,meaning the birth rate (represented by
those under the age of 5) is low (compared to 2010), and the dependency ratio is high. In 2050, it
is projected that therewill be nearly67 individuals dependent on thewages and taxes of every
100working individuals inArizona.
Looking closer at the distribution ofArizonans age 65 and older in 2010 and 2050, it is clear that
a greater proportion of the populationwill be age 65 and older in 2050 thanwere in 2010.
Specifically, the proportion of adults age 65 and older in 2010was about 14 percent while the
projected proportion of the population ages 65 and older in 2050will be about 21 percent. This is
especially transparent at the oldest ages, with the percent of the population represented bymen
andwomen age 85 and older in 2050 being2.7 percent greater than in 2010. Thismeans that by
2050, not onlywill a greater proportion ofArizona?s population be amongArizona?s older
adults, but also that a greater proportion ofArizona?s older adult populationwill be represented
in the oldest age groups.
DependencyRatio
a
=53.9


